
Bitcoin’s On-Chain Roadmap Shows $111,000 – $143,000 As The Range To Watch
As Bitcoin (BTC) resumes recording new all-time highs (ATH), focus is back on key price levels that could provide investors with an idea about the next possible resistance levels that may see a sell-off in BTC. Fresh on-chain data offers a map of BTC’s most important price levels. Bitcoin May Face Resistance At These Levels According to a CryptoQuant Quicktake post by contributor Crazzyblockk, the cost basis (Realized Price) of BTC Short-Term Holders (STH) provides a snapshot of important support and resistance zones. Related Reading: Bitcoin Sharpe-Like Ratio Shows Market In Wait-and-See....
Related News

As Bitcoin (BTC) takes a brief breather after creating a new all-time high (ATH) above $125,000, on-chain data shows that three key indicators played a major role in the digital asset’s latest rally to new highs. These Three Indicators Suggest More Room For Bitcoin According to a CryptoQuant Quicktake post by contributor Arab Chain, fresh data from Binance suggests that BTC is witnessing one of its most significant buying phases since mid-year. Notably, BTC’s price has surged from around $117,000 to $124,000 since the beginning of October. Related Reading: Bitcoin’s On-Chain Roadmap Shows....

Data shows this narrow Bitcoin price range hosts a few key BTC lines, something that could make the range an important support cluster. $94,000 To $97,900 Range Contains Different Bitcoin Price Models In a new post on X, CryptoQuant author Axel Adler Jr has talked about where the nearest support cluster lies for Bitcoin. The […]

Yesterday afternoon, we published our twice-daily bitcoin price watch piece. In the piece, we highlighted the levels that we would be looking at around evening during the Asian session, and suggested that - as a result of the widening of our regular parameters - we could probably get in and out of the markets according to our intra-range strategy. Action has now matured overnight, and - as we head into a fresh European session - what of levels that we are keeping an eye on in the bitcoin price today, and how can we try and draw profit from the market on the back of these parameters? Take a....
Prominent analytics firm Glassnode has shared new on-chain insights into the Bitcoin market, pointing to the next major support zone amid a euphoric market mood on Friday. The world’s leading cryptocurrency briefly surged to above $117,000 after comments from US Federal Reserve Chairman Jerome Powell signaled a possible shift away from the central bank’s long-standing hawkish stance. Related Reading: When Will Bitcoin Bottom Out? This Could Be The Signal To Watch Bitcoin’s Crucial Defense Level At $104,000–$108,000: Data In an X post on August 22, Glassnode explains that Bitcoin’s UTXO....
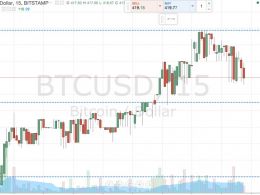
Here's how we are approaching the final session of the week in the bitcoin price, and what we are looking to trade over the weekend. In this morning’s analysis, it looked as though we would be able to implement a pretty tight range and draw profit from any volatility on the breaking out of this range. Having widened this back out again to a more apt timeframe (when compared to yesterday evening’s session) we set up our parameters and risk management setting in anticipation of an entry. As things turned out, we did get an entry, but it didn’t work out exactly as we’d hoped. Take a quick....