
XRP Price Revisits Support Range, Make-Or-Break Moment For Bulls
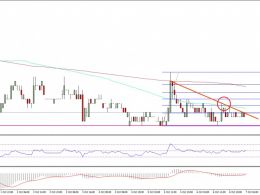
XRP price extended losses and traded below $1.440. The price is now consolidating losses and faces hurdles near $1.4375 and $1.4450. XRP price started another decline and traded below the $1.440 zone. The price is now trading below $1.4250 and the 100-hourly Simple Moving Average. There was a break below a bullish trend line with support at $1.4240 on the hourly chart of the XRP/USD pair (data source from Kraken). The pair could continue to move down if it stays below $1.440. XRP Price Dips Again XRP price failed to stay above $1.450 and extended its decline, underperforming Bitcoin and....
Related News

XRP is entering one of its most crucial weeks in months as a series of bullish catalysts align to set the stage for what could be a breakout move. The token has held firmly above the $2.20 support zone despite the recent market crash, and both technical and fundamental factors now point toward a possible surge in price. According to crypto analyst Guy on the Earth, XRP is in a make-or-break moment, with abundant news catalysts giving traders reasons to stay optimistic about the short-term direction. XRP Holds $2.20 Support; Analyst Eyes Resistance Ahead “Another reversal from lows as XRP....
Over the last week, the Bitcoin bulls looked to have taken control of the price, eventually pushing it back above $73,000 again. There has been a slowdown since then, with bears trying to retest the $70,000 level over the weekend. For now, the bulls are still open, but there is still the possibility that the price will crash again. To that end, the Bitcoin price has an important support level to hold if the bulls are actually going to sustain the uptrend. The Magic Point For Bitcoin Lies At $70,500 After the initial rejection from the range highs, the Bitcoin price is now moving toward a....
MATIC price trades below 50 and 200 EMA on the daily timeframe despite showing some relief strength. MATIC rally caught short as BTC price continued to range. The price of MATIC must hold $0.72 support or face a drop-down to a weekly low. Polygon (MATIC) price showed some bullish strength recently, but the price has struggled to break above key daily resistance against tether (USDT). The price of Polygon (MATIC) has continued to range as bulls sweat over a potential break of the key support zone holding the price of MATIC from having a spiral down to a weekly low. (Data from Binance)....
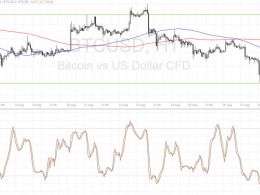
Bitcoin price is stuck in consolidation, stalling at the middle of its range and still deciding whether to make a test of resistance or not. Bitcoin Price Key Highlights. Bitcoin price has been moving sideways recently, bouncing off support at $565 and finding resistance at $585. Price is in the middle of its range for now and may be encountering a bit of resistance at the area of interest. A break above the moving averages could put it on track towards testing the range resistance once more. Technical Indicators Signals. The moving averages are oscillating, which suggests that the....
Ethereum classic price remained above the 0.00182BTC support area against Bitcoin, which exposes it for a break moving ahead. Key Highlights. Ethereum classic price remained in a tight range versus the Bitcoin with almost no major move. There is a tiny bearish trend line formed on the hourly chart of ETC/BTC (data feed via Simplefx), which is currently acting as a resistance. The best part is the fact that the ETC bulls are still able to hold the 0.00182BTC support. Ethereum Classic Price Break. Ethereum classic price is like do not want to make any move. It remained above a major support....