
Solana (SOL) Under Pressure As Downtrend Looks Ready To Resume
Solana failed to settle above $90 and trimmed some gains. SOL price is now facing hurdles near $88 and might decline again below $82. SOL price started a decent recovery wave above $78 and $82 against the US Dollar. The price is now trading below $85 and the 100-hourly simple moving average. There is a key bearish trend line forming with resistance at $85 on the hourly chart of the SOL/USD pair (data source from Kraken). The price could continue to move up if it clears $85 and $90. Solana Price Faces Resistance Solana price remained stable and started a decent recovery wave above $72, like....
Related News
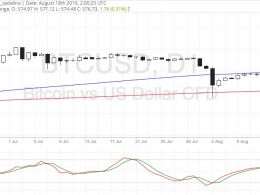
Bitcoin price is pulling up from its slide but might be ready to trend lower upon testing the resistance. Bitcoin Price Key Highlights. Bitcoin price is trading in a downtrend, moving below a descending trend line on its daily time frame. Price is gearing up for a test of the trend line and could be ready to resume the selloff soon. However, technical indicators are suggesting that buying pressure might still be present. Technical Indicators Signals. The 100 SMA is still above the longer-term 200 SMA so the path of least resistance could still be to the upside. In that case, a break past....
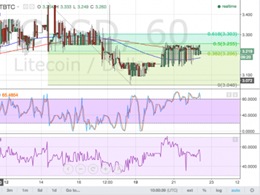
Litecoin Price Key Highlights. Litecoin price has suffered a quick selloff recently and has since showed signs of a pullback. Price appears to be finding resistance at the 50% Fibonacci retracement level around 3.250 and might be ready to resume its drop. If the correction wave for litecoin price is done, the impulse wave could take price down to the previous lows at 3.050 or much lower. Technical Indicators Favor Downtrend. Apart from the inflection points already keeping gains in check, leading and lagging indicators suggest that litecoin price is ready to head back south. The 100 SMA is....
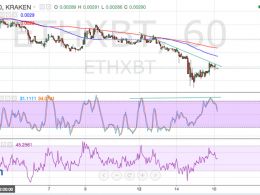
Key Highlights. Ethereum price is still in the middle of a correction from its previous selloff, but technical signals are indicating that the downtrend is set to resume soon. A bearish divergence can be seen, as the pair formed lower highs while stochastic made slightly higher highs. Ethereum price could fall from the current resistance levels back down to the previous lows at 0.00190BTC if selling pressure picks up. Impulse wave to resume. A higher pullback to the 0.00240BTC area near the 100 SMA and the previous support might still be possible if the correction wave isn't over. However,....
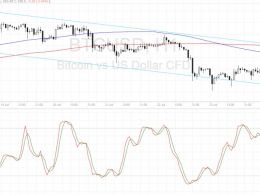
Bitcoin price could be ready to resume its dive since technical signals are indicating that bearish pressure is in play. Bitcoin Price Key Highlights. Bitcoin price recently broke below a triangle consolidation pattern visible on longer-term charts, signaling that sellers are getting the upper hand. Price has since formed a steady downtrend on the 1-hour time frame, moving inside a descending channel pattern. Bitcoin is now testing the channel resistance, with technical indicators suggesting that the selloff could resume. Technical Indicators Signals. The 100 SMA just recently crossed....

Ethereum Price Key Highlights. Ethereum's price has been in a steady downtrend against Bitcoin, as the latter has enjoyed tremendous buying pressure in the past few weeks. A descending trend line can be drawn to connect the latest highs of Ethereum price action, and the Fibonacci levels on the latest swing high and low are near this falling resistance area. Ethereum's price might be ready to resume its selloff after pulling up to the Fibonacci retracement levels on the short-term time frames. Confluence Around 0.002 BTC. The 0.002 BTC level looks like a prime resistance area where plenty....