
The Descending Channel That Can Trigger A Bitcoin Price Crash To $88,000
Over the last few weeks, analysts have been predicting that the Bitcoin price could crash again after the initial October 10 crash. This is because of the weakening market trends that have shown that Bitcoin is still favoring a downtrend at this point. Crypto analyst Lixing_Gan on the TradingView website also shares this view, with the appearance of a descending trend pattern that suggests that the Bitcoin price is more likely to fall than rise. Bitcoin Price At Risk Of Major Crash Below $90,000 So far, the Bitcoin price has been able to maintain its hold above the psychological level of....
Related News
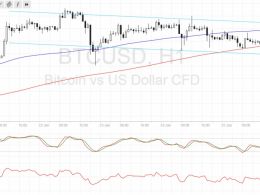
Bitcoin price is slowly making its way down, moving inside a descending channel on its short-term time frames. Bitcoin Price Key Highlights. Bitcoin price seems to have broken below the descending triangle pattern illustrated in an earlier article. Price is establishing short-term downside momentum from here, creating a descending channel visible on the 1-hour chart. Price just bounced off the channel support and could be due for a test of resistance at $930. Technical Indicators Signals. The 100 SMA is above the longer-term 200 SMA so the path of least resistance is still to the upside.....

The Bitcoin price crash began over the weekend and has since seen he digital asset break below the $112,000 support level. Interestingly, this crash was called by a couple of crypto analysts who had pointed out the weaknesses surrounding Bitcoin over this time. As their predictions begin to play out, this report takes a look at the complete forecasts, with most showing that the Bitcoin price crash is far from over and must proceed deeper before finding a bottom. Bitcoin Price Is Headed Below $100,000 Crypto analyst HAMED_AZ had previously pointed out that the Bitcoin price was moving....
Bitcoin’s foray above $70,000, while encouraging, has not really done much to quell the expectations that this is only the start of the bear market. A number of analysts continue to warn investors that this might only be a temporary relief, with the real crash on the way. One of these analysts is HAMED_AZ, who took to the TradingView website to share why the Bitcoin price is still very bearish and why he expects a further crash before the cryptocurrency hits a bottom. Bitcoin Price Still Very Bearish According to HAMED, the Bitcoin price is still very bearish, despite the recent recovery,....

Investors watch trading volume and other momentum indicators alongside descending channel patterns to better gauge when to open and close trades. Buying an asset in a downtrend can be a risky maneuver because most investors struggle to spot reversals and as the trend deepens traders take on deep losses. In instances like these, being able to spot descending channel patterns can help traders avoid buying in a bearish trend.A “descending channel,” also known as a “bearish price channel” is formed by drawing two downward trendlines, parallel to each other, which confine the price action of....
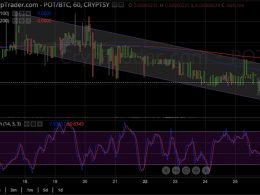
Potcoin Price Key Highlights. Potcoin price has been steadily trending lower, moving inside a descending channel pattern on the 1-hour time frame. Price is testing the latest lows and might be due for a move down to the channel support at 0.00000220BTC or lower. Potcoin price could carry on with its ongoing selloff, as technical indicators also confirm that further losses are likely. Bounce Off Channel Support? Potcoin price might still be able to take a break from its dive if the bottom of the descending channel holds as short-term support. In that case, price could head back up to the....