
Bitcoin Price Technical Analysis for 14/2/2015 - Ride the Lightning!
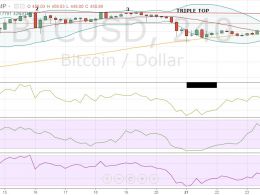
Bitcoin price continued rising today and the market's buying power pushed the price up to a high of $258.92. At the time of my writing of this analysis, bitcoin price is testing the $256 resistance level. By studying the 1 hour Bitfinex (BTC/USD) chart fromtradingview.com and drawing a horizontal line across the $256 resistance/support level (look at the below chart), we can notice that on the 26th of January 2015, bitcoin price exceeded $300. We can also note that the price didn't face any support all through the way from $300 down to $256. Oppositely, as bitcoin rises above $256, it will....
Related News
The Christmas isn’t turning out to be merry for Bitcoin. The cryptocurrency is struggling near the overhead resistance of $465. It is now trading 1.28% lower at $450.89, raising concerns that the market participants might pull out their funds in the holiday season. As a result, several technical indicators are also showing declines. We advised in the previous Bitcoin price technical analysis Target Achieved that traders should book at least partial profits in their long positions. And for today’s analysis, we will again be using the 4-h BTC-USD price chart from BITSTAMP.

Bitcoin rises more than 2 percent to $430.21, nearing our year-end target of $440. In the previous price technical analysis A No Trade Market, we mentioned that an increasing MFI often causes price appreciation, and we are witnessing just that. The question now is: Would bitcoin be able to extend the gains or will it retrace its steps? Let us try to predict this with the help of technical analysis conducted on the 240-minute BTC-USD price chart. Bitcoin is well poised to increase its duration inside the $400-440 range, at least for the next couple of sessions. There is a high probability....
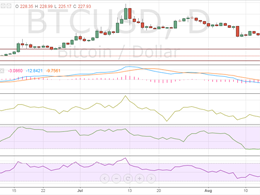
In the previous Bitcoin price technical analysis Rebounds, we discussed how the cryptocurrency was erasing the losses for the past week. But, the entire positivity was put to rest over the weekend as bears made a comeback and long positions were fast liquidated at the slightest hint of a pullback. Bitcoin, which is now trading at $227.93, has once again come closer to its important buying interest zone of $220-225. As the price decline has pushed the price closer to its crucial support, market participants may also be factoring in a breach of support this time, but I would recommend....

Bitcoin briefly topped $250 for the first time since August 19, 2015, hitting a fresh monthly high of $250.09. We concluded the previous Bitcoin price technical analysis Retreats From Monthly Highs on a positive note saying that market participants should not be concerned about the drop and instead go long in Bitcoin near $242 for a target of $250. As can be seen, Bitcoin hit an intraday low of $242.82 before meeting the said target. Bitcoin is currently trading at $248.81, up 1.92 percent. And yes, we stand by our long call! bitcoin price chart. Below are the latest technical....
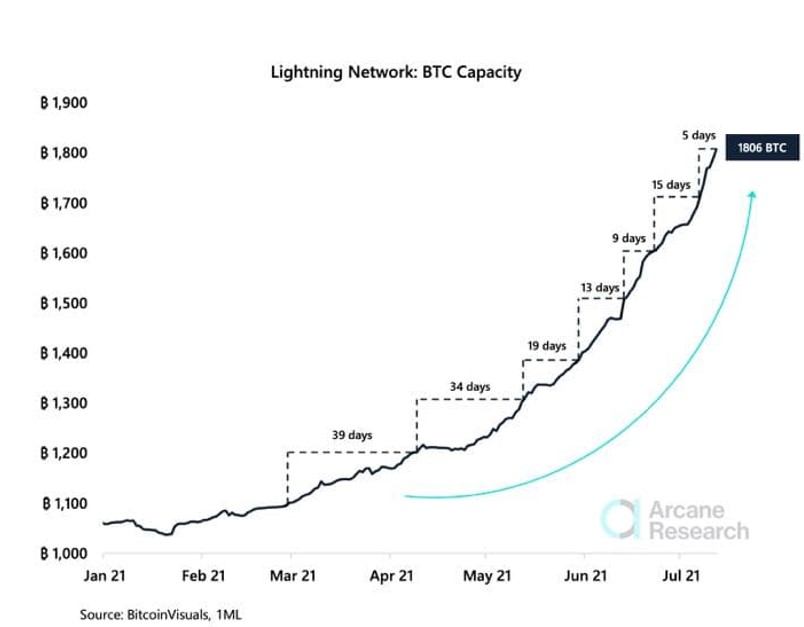
Bitcoin’s second layer payment protocol Lightning Network has been expanding unnoticed by most users. First proposed in 2015 and launched in 2018 as a beta, its adoption and capacity have accelerated during the past few months. The Lightning Network allows users to send fast and low-cost transactions via payment channels. Unlike the Bitcoin-based layer, lightning […]