
Bitcoin Price Technical Analysis for 25/3/2015 - Violating Supports
The Bitcoin markets were in for a rude shock in yesterday's trading session as the price plummeted from $264 to $242, losing more than 8% intraday. The sellers have booked partial profits which helped the price recuperate to $246.88. However, the negative price movement should not have come as a shock to my readers as I have been repeatedly emphasizing that Bitcoin may hit $230 in the medium term. And the recent collapse has only strengthened my belief. Given that a major move has happened in Bitcoin price, it becomes imperative to revisit the technical indicators. An analysis of the....
Related News

It seems that the Bitcoin price is now at the mercy of the bears, because bulls seem to have lost all control. In my yesterday's analysis, I mentioned that the cryptocurrency has been violating crucial support levels, which makes it a perfect sell-on-rise candidate for a target of $230. In the past 24 hours, the digital currency is little changed from $246.88 to the current $245.27. However, it was not without its fair share of volatility as the price slumped 4% intraday to a low of $236 before quickly pairing the losses. I expect volatility to remain an integral part of the upcoming....

Bulls have faltered in their upward march and given to the bears an opportunity to gain control. As a result, technically important support levels have been breached which could lead to more losses in the value of Litecoin. In my previous analysis, From Resistance to Support!, I did mention that all the long positions must be built with strict stop-losses. Since the supports have been breached, a lot of long positions may have been squared. Litecoin is down 1.66% to $1.771 since yesterday. Technical analysis of the 240-minute LTC/USD price chart reveals that market participants should look....

In the conclusion of the previous Bitcoin price technical analysis And Here Comes the Rebound, I stated that the current relief rally in Bitcoin will fizzle out very soon and that the market participants should be prepared to create short positions. We have seen this happen in yesterday's trading session where attempts made by the bulls to scale higher were undone by profit booking and renewed selling pressure. Bitcoin is currently trading flat at $224, after racing to an intraday high of $231.09 and is now expected to trend lower in the coming sessions. Bitcoin will witness a greater....
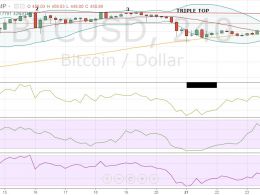
The Christmas isn’t turning out to be merry for Bitcoin. The cryptocurrency is struggling near the overhead resistance of $465. It is now trading 1.28% lower at $450.89, raising concerns that the market participants might pull out their funds in the holiday season. As a result, several technical indicators are also showing declines. We advised in the previous Bitcoin price technical analysis Target Achieved that traders should book at least partial profits in their long positions. And for today’s analysis, we will again be using the 4-h BTC-USD price chart from BITSTAMP.

As mentioned in the previous Bitcoin price technical analysis, Afloat, But For How Long?, the remarkable work done by the bulls to defend their crucial weekly support of $220-225 has finally paid off during this weekend as Bitcoin price surged 5.29 percent to $241.01. During the latest price move, Bitcoin also crossed a near-term resistance which had kept it subdued for several sessions. But let us now discuss the price targets, the supports and the resistances. Bitcoin Chart Structure - Since August 19th, Bitcoin had been trading with its upside capped near $235 (we discussed this....