
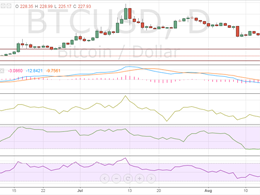
Bitcoin Price Technical Analysis for 20/5/2015 - Steady Decline!
Bitcoin has slipped further following the slow downtrend as the volume activity remains fairly muted. From yesterday's observation of $234, Bitcoin has dropped to $231.98 while respecting the level of $230. It was mentioned in the previous analysis that $229 would act as a support level for the virtual currency. The 240-minute BTC/USD price chart has been technically checked to revise the trading strategies. Bitcoin Chart Structure - The chart structure indicates that Bitcoin has come in close proximity to the previous low of $229, and hence, a bout of short covering may hit the market....
Related News

Darkcoin digs deeper into the red as the price slips from 0.0158BTC to 0.01473BTC in the past 24 hours. Previous lows were violated with the price plummeting to a new low of 0.0143BTC amid the selling pressure. Bulls are caving in to the pessimism and the cryptocurrency may see further downside in the absence of any positive trigger. Upon implementation of the technical analysis on the 240-minute DRK/BTC price chart, it can be concluded that the bearish momentum will only intensify from here on. However, the price decline may not be abrupt but could rather be steady. Chart Structure - Ever....
In the previous Bitcoin price technical analysis Rebounds, we discussed how the cryptocurrency was erasing the losses for the past week. But, the entire positivity was put to rest over the weekend as bears made a comeback and long positions were fast liquidated at the slightest hint of a pullback. Bitcoin, which is now trading at $227.93, has once again come closer to its important buying interest zone of $220-225. As the price decline has pushed the price closer to its crucial support, market participants may also be factoring in a breach of support this time, but I would recommend....

In my previous Bitcoin analysis, I had mentioned the possibility of the price touching $230 in the near term, and as can be seen, the virtual currency cracked roughly 1.5 percent to $231.44. However, bulls have managed to pare most of the losses, bringing the price back up to $234. With price slipping further, it only becomes necessary to revise the technical levels. An analysis of the 240-minute BTC/USD price chart has been carried out for the aforementioned purpose. Bitcoin Chart Structure - The chart above represents the slow, downward movement of the virtual currency. With steady....

Litecoin has dropped 6.47 percent to trade at $2.733 as the underlying negativity comes to the fore. We discussed in the previous Litecoin price technical analysis The Pressure is Evident that there is a very low probability of the price trending higher and that bears may make an early comeback. This decline has also brought the price closer to its very important technical support of the 200-day simple moving average (SMA). The question that the trading community is now asking is: will this level cushion Litecoin once again? I continue to remain bearish on Bitcoin as well, which I believe....

The weekend brought pain for Bitcoin, but that was always on the cards. My Friday's Bitcoin price technical analysis Palpable Strain concluded on a bearish note saying that a close below $286 could bring in further decline, and as can be seen, the cryptocurrency did slump intraday to $276.57 before taking support from near the previous consolidation level of $275. Bitcoin is currently trading at $281.26. Now, the important question that must concern the trading community is: Is this relief from the support level for real or is it a trap? This analysis will aim to provide some answers.....