
Bitcoin Price Technical Analysis for 7/10/2015 - The Momentum Grows Stronger
Bitcoin has finally achieved its near-term price target of $245. Throughout its rise and glind, the cryptocurrency has seen its momentum and strength readings edge significantly higher. Bitcoin is currently trading up 2.46 percent at $246.59. But things are not all hunky-dory, as we will be analyzing below. Bitcoin Chart Structure - As can be concluded from the daily BTC-USD price chart above, Bitcoin has taken out its previous top on the back of strong momentum. The critical 200-day SMA of $245.7423 has also been breached on this occasion. But sustaining above this level will be the key....
Related News

Bullish bias is still evident in Litecoin even as the cryptocurrency fell sharply from 2.14 to 1.98. As discussed in yesterday's analysis, the recent correction in Litecoin presents to us an incredible opportunity to buy as the price structure strongly favors the bulls. Each Litecoin is currently trading at $2.05. A precise technical analysis on the 240-minute LTC/USD price chart indicates that the digital currency may have bottomed out and head higher to take out the 2015-peak eventually. Technically, Litecoin seems to be enjoying a positive undertone. Price chart and technical indicators....

Bitcoin has started this week on a very strong note as it raced higher to $247.53, on course to its highest closing in over a month. In the previous Bitcoin price technical analysis Mixed Technicals, we discussed how a couple of technical indicators were showing divergences from the other two. Well, currently, all of them are displaying much stronger readings. Bitcoin is trading at $247.53, after hitting a monthly high of $248.50. Even though Bitcoin is in a strong uptrend, let us review the latest technical indications to look for factors that may hamper the bullish mood. Bitcoin Chart....
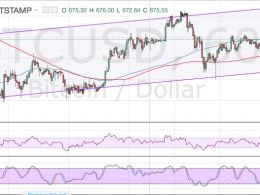
Bitcoin price got a boost from fresh concerns in the UK financial sector, leading traders to price in more uncertainty. Bitcoin Price Key Highlights. Bitcoin price appears to be showing a return in bullish momentum as it bounced off a nearby support zone. Bitcoin seems to be on track towards climbing to the top of its ascending channel on the 1-hour time frame. For now, price is still hovering around the mid-channel area of interest, waiting for a stronger surge in bullish momentum. Technical Indicators Signals. The 100 SMA is still above the 200 SMA so the path of least resistance is to....

In my previous analysis titled Wide Divergences, I had pointed out some eerie disconnects between the Bitcoin price action and the technical indications. It is highly possible that the price eased a little in order to properly reflect the underlying technical considerations. Bitcoin is currently trading down 1.32% at $275.99. However, I am very concerned about the incessant crash in the momentum reading, which is worsening by the day. A decline in the momentum value in flat trading cannot bode well for the long holders. Read below the technical observations of the daily BTC-USD price....

Litecoin falls 2.19 percent to $3.030 as market participants booked profits in their long positions. The cryptocurrency fell from a high of $3.120 to a low of $2.994 before recouping losses partially. Litecoin Chart Structure - As Litecoin falls towards its strong support (marked in the daily LTC-USD price chart above), buyers are rushing in to buy the cryptocurrency. That is good trading sense given that the trendline has been retested 4 times before and has resulted in a stronger rebound. But, this time, things may work out differently. Why? Read on below what the technical indicators....