
Bitcoin Price Watch; Pattern Completes!
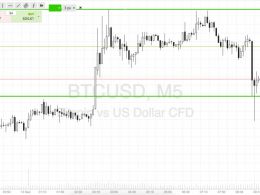
If you read yesterday’s analysis, we noted that a classical technical charting pattern was in the process of forming in the bitcoin price. The pattern in question, an inverse head and shoulders pattern, suggested that – upon completion – we could see some considerable upside heading into the Asian session and, beyond, in to today’s European action. The bitcoin price has now matured, and as we head into the mid European afternoon on Thursday, it’s time to take a look at whether our bias proved valid and, in turn, what we can expect as we head into the close of today’s European session and....
Related News
Here's a look at what we are focusing on in the bitcoin price this morning. It’s Tuesday morning, and time to take the first of our two looks at the action in the bitcoin price for today. Before we do, let’s take a quick look at what happened overnight, as this is going to influence how we approach the markets this morning. Specifically, action last night formed something of a head and shoulders pattern on the five-minute chart. A head and shoulders forms when we get a peak, a dip, a higher peak, which then dips into another peak similar in height to the first, but not as high as the....

Shortly before European markets closed yesterday, we published our twice-daily bitcoin price watch piece, and highlighted the levels that we thought we would be watching during the Asian session last night. We also suggested that a classical technical charting pattern was forming in the bitcoin price - namely a head and shoulders pattern - and that this could hint at some bearish momentum and a reversal of the longer-term bullish trend we have seen over the past couple days. Action has now matured, and we have seen a validation of this pattern and the reaching of our downside intraday....
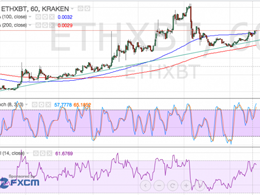
Ethereum Price Key Highlights. Ethereum price has been trending higher on the short-term time frames, as the rising trend line support is still holding. Price hit a major area of interest visible on the longer-term charts, triggering a pullback to the trend line. Ethereum price could be in for a short-term downtrend if it breaks below the trend line and completes a head and shoulders pattern. Watch 0.00300 Closely. The neckline of the head and shoulders reversal pattern lines up with the trend line support around the 0.00300 level, with a downside break likely to confirm that further....

Crypto analyst Bobby revealed that the XRP price has completed a consolidation pattern, hinting at a potential parabolic rally for the altcoin soon. The analyst suggested that XRP’s price could rally to double digits once this rally occurs. XRP Price Eyes Rally To $19 As It Completes Double-Bottom Pattern In an X post, Bobby indicated that the XRP price has completed the macro double-bottom pattern, which it had spent over seven years building. The analyst’s accompanying chart showed that the altcoin is now gearing up for a rally to as high as $19 following the completion of this....

Action has been a bit choppy in the bitcoin price over the last few days, but it hasn't stopped us drawing a profit from the market. Here's what we are looking at in today's European markets and beyond. Yesterday afternoon, our bitcoin price watch article highlighted a bunch of key levels, and in the article, we were able to define a classical pattern that suggested – from a technical perspective, at least – we were set for a continuation of the downside break we saw a little earlier in the day. A look at the action that succeeded our analysis shows a mixed response to our predictions. We....