Litecoin Price Technical Analysis For 11/01/2016 - Trend Line Resistance
Litecoin price finally managed to find bids near a major support area of $3.50, as it represents a monster barrier for sellers. It acted as a support and resistance both on many occasions, and can be seen as a pivot point for the price. The price after testing the stated support area moved back higher, and currently heading towards a bearish trend line formed on the hourly chart (data feed from Bitfinex). The stated trend line acted as a catalyst for a downside move, and may continue to stall gains in the short term. If buyers need to take the price back towards the last swing high of....
Related News

Starting from today, I will be posting a daily litecoin price technical analysis, so I guess it's better to establish key resistance and support levels that will be a base for our future analyses during the upcoming couple of weeks. Litecoin price increased to score a high of $2.04 yesterday, before dropping to a low of $1.79. By examining the 1 hour (LTC/USD) and (BTC/USD) charts, we can clearly see that litecoin price is mirroring what is happening on the bitcoin charts. By studying the 1 day Bitfinex (LTC/USD) chart from tradingview.com and plotting the Fibonacci retracement fan along a....
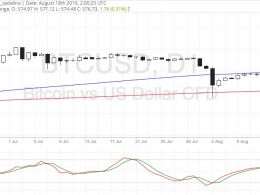
Bitcoin price is pulling up from its slide but might be ready to trend lower upon testing the resistance. Bitcoin Price Key Highlights. Bitcoin price is trading in a downtrend, moving below a descending trend line on its daily time frame. Price is gearing up for a test of the trend line and could be ready to resume the selloff soon. However, technical indicators are suggesting that buying pressure might still be present. Technical Indicators Signals. The 100 SMA is still above the longer-term 200 SMA so the path of least resistance could still be to the upside. In that case, a break past....
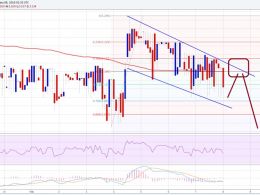
Litecoin price stalled around the $3.30 area. It is currently under a lot of bearish pressure that could result in a sharp downside move. Major Support Level (HitBTC) can be $3.10. Crucial Resistance Level (HitBTC) may be $3.18. Litecoin price after trading as high as $3.20 (data feed via Bitfinex) found resistance and started to move down. There was a lot of selling pressure noted, which resulted in a continuous downside move. There is a bearish trend line formed on the 30-min chart (data feed via Bitfinex), as highlighted in this past week’s analysis. We sold a couple of times around the....
Litecoin price if stays positive may trade higher. There is an inverse head and shoulders pattern in making that can ignite an upside rally. Support Level (HitBTC) is at $3.08. Resistance Level (HitBTC) may be $3.18. Litecoin price is showing a few positive signs on the lower as well as on the higher time frame charts. The price yesterday attempted on a couple of occasions to clear a bearish trend line formed on the 30-min chart (data feed via Bitfinex), and buyers finally succeeded in taking the price higher. The price cleared yesterday’s bearish trend line, but there is now another....

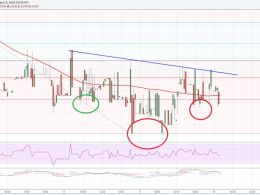
Litecoin price fell further and traded towards our final sell target. Moving ahead, a short-term recovery is possible as the price is approaching a critical support. Litecoin price headed down yesterday, as seller remained in action and buyers failed to hold the downside break. Out long followed bearish trend line on the hourly chart (data feed from Bitfinex) continued to play a major role and ignited a solid downside move. As can be seen from the chart attached, there were more than 4 attempts to break the highlighted trend line and resistance area, but buyers failed.