Bitcoin Price Technical Analysis For 03/23/2016 – March Outlook Negative!
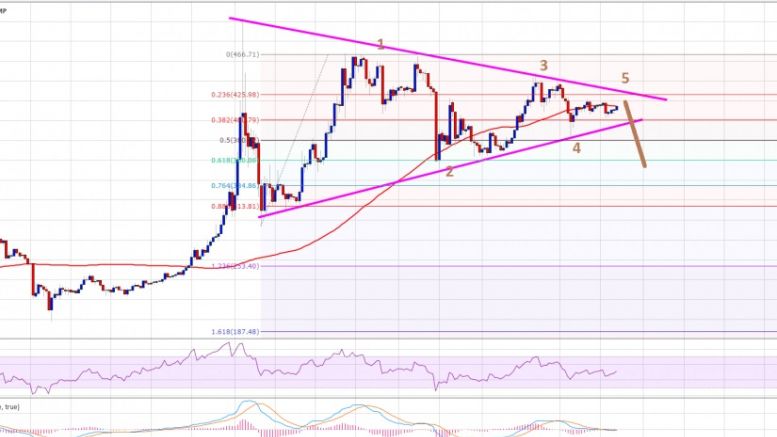
Bitcoin price is eyeing for a break in March 2016. Let us see how it may trade during the remaining part of the week. Intraday Support Level can be $400. Intraday Resistance Level may be $425. Bitcoin price is trading in a range for the past couple of weeks, but if we look at the weekly chart, then we will know that BTCUSD is actually forming a breakout structure. There is a contracting triangle pattern forming on the daily chart (data feed from Bitstamp), which can be seen as a major pattern for the next move in Bitcoin price against the US dollar. If we look at the wave count, then the....
Related News

XRP’s price action has managed to hold above $1 for over a year, but technical analysis shows this could be over soon. Notably, technical analysis from crypto analyst CasiTrades warned about a bearish outlook on the token, with the outlook that there’s still a multi-stage decline in play, which could cause the price of XRP […]
XRP’s price action took a bearish turn last week, but not everyone is viewing the decline as a negative development. A technical outlook shared by crypto analyst Diana asserts that the current move may represent a decisive moment in XRP’s broader market structure. According to the technical outlook, the ongoing selloff is now in a […]

Litecoin falls 1 percent as Bitcoin extended its slide over the weekend. Now at $3.899, Litecoin is in a strong downtrend and price advances can be used to go short in the counter with tight stops in place. Technical analysis of the daily LTC-USD price chart conveys that pessimism still weighs on the cryptocurrency and good profits may be made on creating short positions at extremely low risks. But practicing the stop-losses is the key! Litecoin Chart Structure - The price chart conveys that Litecoin is trading in a lower top, lower bottom structure (marked in the chart), where repeated....
Technical analysis shows that Dogecoin is looking to break out from a key structure zone near $0.26, which could cause a change in market momentum. This technical outlook comes amidst a bearish week for DOGE, which has seen it breaking below support levels and erasing its gains throughout January. According to a technical analysis of […]

Bitcoin price is reattempting a move higher but the progress is slow and both technical and sentiment analysis shows a bearish mood in the chart. Yesterday’s technical analysis concluded that the outlook for bitcoin price is bearish while it fails to break above the prevailing resistance ceiling (blue down-sloping line in the chart). Ongoing analysis is informed by the position of price in relaiton to this ceiling: if the market can successfully trade price above it, we can expect continuing advance. As long as price remains below it, we can expect another series of lower lows. Mood....