
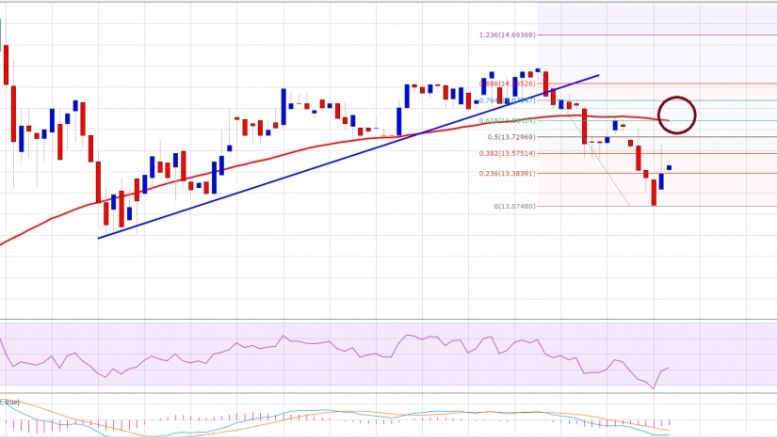
Ethereum Price Technical Analysis – Signs Of Weakness Emerge
Ethereum price may trade down if the ETH/USD bulls fail once again to take it close to the $15.00 level moving ahead. Key Highlights. Ethereum price failed once again to trade near the $15.00 level vs the US dollar and moved down. Yesterday’s highlighted bullish trend line on the hourly chart (data feed via Kraken) of ETH/USD was broken during the downside drift. Two failures to trade and break $15.00 suggests that the price is starting to feel the heat in the short term. Ethereum Price to Weaken? Ethereum price ETH yesterday attempted to trade higher, but failed to near the $14.40 level....
Related News

A crypto analyst, who publishes technical analysis to his audience on X, has released a zoomed-out weekly Ethereum chart that interprets the current price weakness as the final stage of a multi-year accumulation cycle. As it stands, the Ethereum price is trading around $2,100 and 57% below its peak. Therefore, the technical analysis is suggesting that […]

Chainlink has been showing signs of weakness throughout the past few days, but this trend may be shifting as the cryptocurrency rebounds today alongside Ethereum and other major altcoins. The introduction of Ethereum 2.0 – with a scheduled release in December – is the event that is driving this rally. There’s a strong possibility that […]
A trend of underperformance against Bitcoin has plagued Ethereum as of late, which has caused buyers to show signs of capitulation Where the ETH trends in the mid-term should depend largely, if not entirely, on whether or not BTC continues rising in isolations Bitcoin’s massive rise as of late has not done much to boost altcoins, as many are still showing signs of weakness at the moment This weakness has been apparent while looking towards […]

Ethereum has started to show signs of life again after weeks of muted price action, but one analyst believes the current move is only the beginning of something much larger. This inclination is based on a technical setup built around a hidden inefficiency zone after the Ethereum price recently broke above $4,500. The technical analysis shows that the unfilled gap may be the first waypoint in a recovery that eventually pushes the ETH price to five figures above $10,000. The FVG Zone Now Acting As A Magnet Technical analysis done by crypto analyst Crypto Patel laid out a path to where the....

Ethereum has dropped 1.5 percent to 0.00197BTC, in line with our bearish expectations. We iterated our short view in the previous technical analysis titled Bitcoin-fueled bounce fades away. The price action in the past 24 hours has been strongly bearish and threatens a further 4% drop in the pair. Chart Structure – The underlying weakness in ETH-XBT forced the pair below the 20 4-h SMA (we discussed this possibility in the previous price analysis). The bulls did attempt to reverse the losses but failed miserably as the bears used the breached moving average as an offloading level. The pair....