Ethereum Price Technical Analysis – Trend Line Proved Worth
Ethereum price weakened during the past couple of sessions against the US Dollar, and looks under pressure in the near term. Key Highlights. Ethereum price dived sharply intraday against the US dollar and moved below the $12.00 area. Yesterday’s highlighted bearish trend line on the hourly chart (data feed via Kraken) of ETH/USD acted as a perfect barrier and pushed the price down. The price failed to break the highlighted resistance area, and moved down by more than $2. Ethereum Price Downside. Ethereum price ETH continued to find offers near a major resistance area as highlighted in....
Related News
Key Highlights. Dogecoin climbed one more time, but failed to create a new high above 92.6 Satoshis. The price is struggling to settle above 90.0 Satoshis, which is a worrying sign. Our previous week's bullish trend line proved worth, and protected downsides recently. Buyers continued to buy Dogecoin whenever the price moved lower as sellers struggled lately to protect gains. Importance of 90.0 Satoshis. In the weekly analysis, we highlighted that the price created a new high and traded as high as 92.6 Satoshis. After a short-term correction, the price once again found support around an....

Dash Price Key Highlights. Dash price failed to move lower, and found support around a critical trend line as highlighted in yesterday's analysis. The Double top pattern is still valid, as the price is below the resistance area. If there is a break above 0.0130BTC, then more gains are possible in the near term. Dash price acquiring bids around the bullish trend line is a positive sign for buyers looking ahead. Trend Line Proved Worth. Yesterday, we highlighted that there is a possibility of a double top pattern forming on the hourly chart which could result in a move lower. There was a....

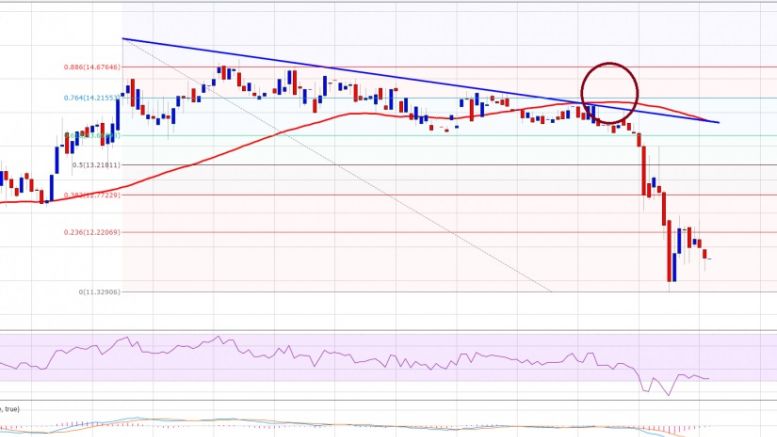
Key Highlights. Ethereum price found resistance around the bearish trend line as highlighted in yesterday's post. There was a downside reaction, which took the price further lower to create a new low of 0.00242BTC. More losses are possible moving ahead, as there is a lot of bearish pressure at the moment. Ethereum price remains at risk of a break lower, as it moved below 0.00250BTC and looks poised for more losses. New Low? The Ethereum price made an attempt to correct higher, but it found sellers on the upside. An immediate resistance around the 23.6% Fib retracement level of the last....
Key Highlights. Dogecoin price grinded lower and cleared a major support trend line on the 2-hours chart (price feed from CEX. IO). A new low was formed below 35.0 Satoshis, as our highlighted trend line and resistance area in the weekly analysis proved worth. The price is under a lot of bearish pressure, and if sellers remain in action there is a chance of a move towards 30.0 Satoshis. Dogecoin price may continue to weaken, as buyers are finding it really hard to take control and as a result, more losses are likely. 100 MA as Pivot. Dogecoin price faced a tough time around a major....

After a volatile first half, Bitcoin price action has been grinding sideways, seeking to find some type of reliable support. Although there has yet to be a clear sign of a reversal, the top cryptocurrency by market cap might have finally found support at a ten-year-long trend line. Complicated Technical Analysis Or This One Simple Trend Line Trick? Technical analysis is the study of chart patterns, trading indicators, Japanese candlesticks, and other data points in an attempt to predict future price action. The very basis of most technical drawings and chart patterns begins with a simple....