
Bitcoin Price Meanders to the Starting Line
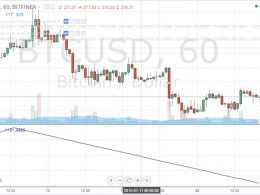
Bitcoin price rebounds to the upside, but the block reward halving waiting game continues (amid growing suspense). The strong reaction from the low near $600 (Bitstamp) does not yet resemble an advancing wave, yet, even if it did there is no xbt.social buy signal in the 1hr chart and we remain out of the market until we see a clear signal in either direction. For now, price advance has run into resistance at the 200MA (red) in the 4hr chart. The sense is that the market is eager for advance. There are large buy orders filling in under price and the expectation of a block reward halving....
Related News
During the past 48 hours, we observed the sideways movement of bitcoin price, which reflects the market's attempt to correct the price. As per our analysis yesterday, the bitcoin price was oscillating between $203-205 and $213-217 creating a slightly downward sloping trend line as the price is attempting to break out of the $220 resistance line. The day started with a rise in bitcoin price that broke out of the trend line we plotted yesterday on the 1 hour Bitfinex Bitcoin/USD chart (look at the above chart). At the time of writing of this article, the price reached $216, which is above....

Bitcoin Price Key Highlights. Bitcoin price is starting a downtrend on its 1-hour forex chart, with a descending trend line connecting the latest highs since the start of the month. Price is currently testing the trend line resistance near the Fibonacci retracement levels and might be ready to resume its slide. Bitcoin price appears to be finding resistance at the 50% Fibonacci retracement level while technical indicators are hinting that the selloff could carry on. Correction Almost Over. Bitcoin price already bounced off the 50% Fib on its first test but it seems to be making another....

Bitcoin price meanders near its low, apparently acquainting itself with long-term support. Chart technicals to one side today, as we consider the question “Do fundamentals drive price?” Today’s article considers the bitcoin price chart in context of similar speculative markets. The discussion focusses on the notion of fundamentals. The term fundamentals is used in its broadest sense, and not in the strict investment definition that refers to company balance sheets, work in progress, and so on. Although there are parallels between the bitcoin price market and other commodity markets, as....
Bitcoin price could be starting a new uptrend but it needs to find support at the nearby Fib levels before confirming this climb. Risk-on flows appear to be supporting the cryptocurrency and weighing on dollar demand. Bitcoin price appears to be starting a new trend on its short-term time frames, as an ascending trend line can be drawn to connect the recent lows of price action. Technical indicators are also hinting at a start of a short-term uptrend, with the moving averages looking prime for an upward crossover. Using the Fibonacci retracement tool on the latest swing high and low....

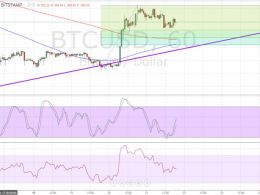
The Bitcoin price is in a holding pattern awaiting a directional watershed. Last Friday price bounced off a rising trendline, originating at a price low set in 2012, and is now approaching it, once again, as trade meanders sideways. The side of the trendline that the market chooses could set the direction of trend for the coming weeks. Update 17h50 UTC. The market has decided. A few minutes ago, the Bitcoin price touched the rising trendline and launched into a strong advancing wave. Not sure that the trendline can take all the credit, though - keep your CCN home page refreshed for a....