Ethereum Price Technical Analysis – Is This A Break We Needed?
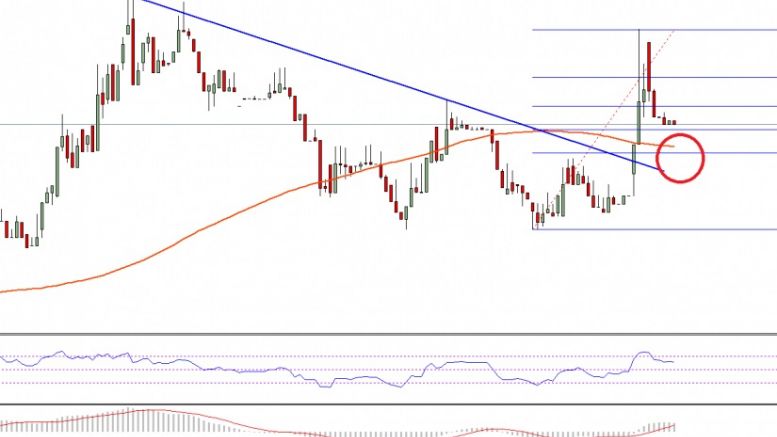
Ethereum price traded higher intraday, and looking at the current technical indicators it looks like it may trade further higher. Key Highlights. Ethereum price managed to move higher against the US Dollar and broke a major resistance area. Yesterday’s highlighted bearish trend line on the hourly chart (data feed via Kraken) of ETH/USD was broken during the recent upside ride. The price is now above the 100 hourly simple moving average, which is a positive sign for the bulls. Ethereum Price Buy. Ethereum price ETH surged higher against the US Dollar and posted a critical break intraday (as....
Related News
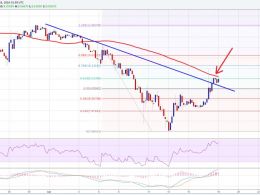
Ethereum price may gain further in the short term. ETH bulls have to break the 100 SMA resistance area for a move towards $10.50. Ethereum price ETH gained traction recently against the US Dollar and managed to climb above a major resistance area of $8.50. During the upside move, ETH/USD also broke a bearish trend line on the 4-hours chart (data feed via Kraken) to set the pace for more gains. However, the upside was stalled near the 100 simple moving average (H4 chart), which is currently acting as a barrier and preventing gains. If the price has to gain more strength, then ETH bulls have....
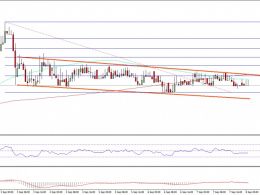
Ethereum price failed to gain momentum, and remained in a range. Let us see what may happen next and whether there can be any more or not. Key Highlights. ETH price remained in a small range against the US Dollar, which is now annoying for investors. There is a channel pattern formed on the hourly chart (data feed via SimpleFX) of ETH/USD, which may provide us a few moves in the near term. A break above $11.60 is needed for the next move in the ETH/USD pair. Ethereum Price Breakout Pattern. Ethereum price declined a few points yesterday against the US Dollar, as the ETH bulls failed to....
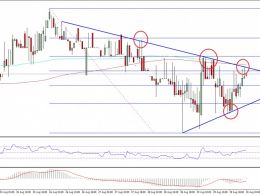
Ethereum price managed to bounce a couple of times from the lows and currently attempting to break a major resistance area. Key Highlights. ETH price after a couple of spikes lower against the US Dollar managed to recover. There is a new bearish trend line formed along with a support on the hourly chart (data feed via SimpleFX) of ETH/USD. A break either lower or higher is needed for the next move in ETH/USD. Ethereum Price Bearish Trend Line. Ethereum price ETH struggled during yesterday versus the US Dollar and traded lower on a few occasions. However, the ETH buyers appeared later and....

Technical analysis shows that Ethereum’s price action is currently completing a market structure that shows signs of revival. After weeks of struggling below key levels, Ethereum now appears to have completed a market structure break, with a technical analyst pointing to $1,500 as the zone where buyers have regained control, and a break above $4,000. Ethereum Structure Break And The $1,500 Turnaround Point Crypto analyst SwallowAcademy, in a recent technical breakdown of Ethereum’s weekly candlestick chart, noted that buyers have successfully initiated a clean market structure....

Ethereum price traded down near $7.0 where buyers appeared. Currently, it looks like there is a chance of ETH/USD breaking higher in the short term. Ethereum price ETH made a perfect bottom near $7.0. I highlighted in yesterday’s analysis that there is a chance of ETH/USD moving down towards $7.0, which can then produce a bounce. The price did test the mentioned level and moved higher later. There was a nice upside reaction, signaling more gains in the near term. ETH/USD is currently attempting to break a bearish trend line on the hourly chart (data feed via Kraken), which is also....