Ethereum Price Technical Analysis – Trend Line Support Helped
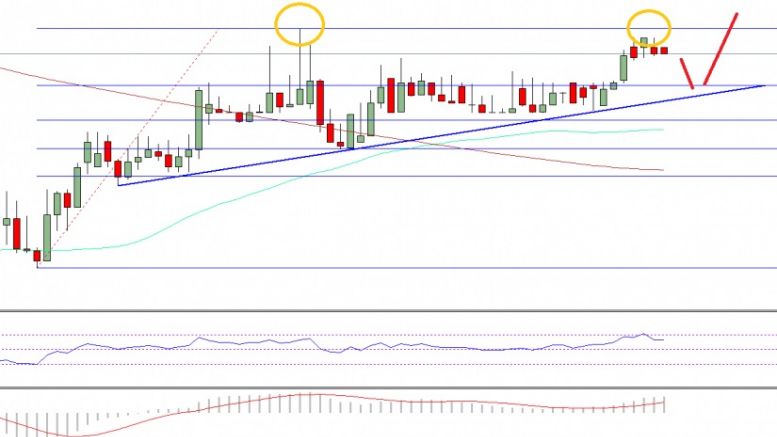
Ethereum price is slowly and steadily grinding higher against the US Dollar, but it lacks momentum to clear a couple of important resistance levels. Key Highlights. Ethereum price after a minor correction against the US Dollar found buyers on the downside. Yesterday’s short-term bullish trend line highlighted on the hourly chart (data feed via SimpleFX) of ETH/USD acted as a perfect support area. On the upside, the pair is still struggling to break the $11.20-30 resistance, which may ignite another correction. Ethereum Price Support. Ethereum price ETH yesterday moved a few points lower....
Related News
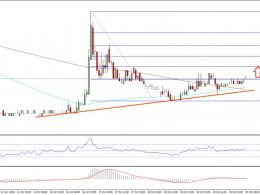
Ethereum classic price is attempting a recovery against the Bitcoin, and it looks like ETC buyers may attempt to take the price towards 0.00170BTC. Key Highlights. Ethereum classic price stayed above yesterday’s support area of 0.00153BTC against the Bitcoin. Yesterday’s minor new bullish trend line on the hourly chart of ETC/BTC (data feed via Simplefx) acted as a support once again. The pair is recovering, and there are chances of more gains in the short term. Ethereum Classic Price Recovery. ETC Classic price after yesterday’s decline managed to find bids against the Bitcoin at....

Ethereum price after a minor correction against the US Dollar found support near a trend line and currently trading back higher. Key Highlights. ETH price moved down a few points versus the US Dollar, but found bids near a major support. This week’s highlighted bullish trend line on the hourly chart (data feed via SimpleFX) of ETH/USD continued to act as a barrier for the sellers. The price is currently bouncing from the trend line support and looks set for more gains. Ethereum Price Upside Move. Ethereum price remained lower yesterday against the US Dollar until it found support near a....

Ethereum Price Key Highlights. After forming a head and shoulders pattern indicated in yesterday's technical analysis article, ethereum price broke below the neckline and confirmed the potential selloff. Price also broke below the rising trend line support, adding to the downtrend signals on the 1-hour time frame. Ethereum price could have its sights set on the next visible floor around 0.0200, although a pullback to the broken neckline and trend line support might be seen. Resistance at 61.8% Fib? The 61.8% Fibonacci retracement level is closest to the broken rising trend line and is also....

After a volatile first half, Bitcoin price action has been grinding sideways, seeking to find some type of reliable support. Although there has yet to be a clear sign of a reversal, the top cryptocurrency by market cap might have finally found support at a ten-year-long trend line. Complicated Technical Analysis Or This One Simple Trend Line Trick? Technical analysis is the study of chart patterns, trading indicators, Japanese candlesticks, and other data points in an attempt to predict future price action. The very basis of most technical drawings and chart patterns begins with a simple....

Ethereum price traded above the $11.00 handle vs the USD, and it looks like there are more upsides left in ETH/USD in the near term. Key Highlights. Ethereum price spiked higher vs the US Dollar intraday and appreciated by more than 10%. Yesterday’s bullish trend line on the hourly chart (data feed via Kraken) of ETH/USD played well, as the price bounced perfectly after testing it. There is a chance of a minor correction from the current levels, which can be seen as a buying opportunity. Ethereum Price – Buying Dips? Ethereum price ETH as mentioned bounced during the past couple of....