Ethereum Price Technical Analysis – ETH/USD Targets Additional Weakness
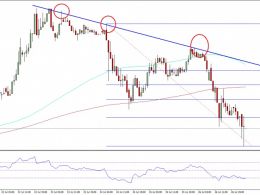
Ethereum price declined further during the past 24 hours to trade as low as $10.97 where the ETH/USD buyers managed to protect the downside. Key Highlights. ETH price jaw dropped versus the US Dollar, and moved below the $11.50 support area. There is a new bearish trend line formed on the hourly chart (data feed via SimpleFX) of ETH/USD, which may stop the current recovery. On the upside, the $11.60-65 levels can now be considered as a major resistance area. Ethereum Price Downside Move. ETH price continued to move down versus the US Dollar, and even traded below the $11.50 support area to....
Related News

Dogecoin Price Key Highlights. Dogecoin price failed once again to trade above the 100 hourly moving average and declined intraday. The price continued to struggle and our forecast to target additional weakness remains intact. More losses are likely in the near term as long as the price is below 76.0. Dogecoin price fell one more time yesterday and almost tested the last low of 64.7 Satoshis, which is a strong bearish sign. How important is 100 MA? Dogecoin price fell intraday as forecasted in yesterday's analysis. We were anticipating a new low below 64.7 Satoshis, but the price managed....

Ethereum has dropped 1.5 percent to 0.00197BTC, in line with our bearish expectations. We iterated our short view in the previous technical analysis titled Bitcoin-fueled bounce fades away. The price action in the past 24 hours has been strongly bearish and threatens a further 4% drop in the pair. Chart Structure – The underlying weakness in ETH-XBT forced the pair below the 20 4-h SMA (we discussed this possibility in the previous price analysis). The bulls did attempt to reverse the losses but failed miserably as the bears used the breached moving average as an offloading level. The pair....

This analysis report take an historical perspective of the BTC/USD price chart. In the absence of the most complete historical price chart, namely that of Mt. Gox, this report will use the BTC-e chart, and try to make sense of all its spikes and idiosyncracies, in an effort to make both medium / long term forecasts and price predictions for the BTC/USD pair. Takeaway. Technical analysis reveals that BTC/USD has a medium term upside target above $2,000 (see chart below). However, there is no conclusive sign that the decline since December 2013 is over. A break above the upper resistance TL....

At the time of writing, the Bitstamp exchange price has entered a holding pattern around $575. Bitcoin price began descending yesterday, 10 August, with acceleration becoming evident today during the US trading session. At the time of writing, the Bitstamp exchange price has entered a holding pattern around $575. Additional downside seems inevitable, and chart analysis suggests that the current wave down may be the last. However, it may also be the strongest wave of the current decline. Before making a hasty trading decision, be sure to read the analysis below and take note of the likely....
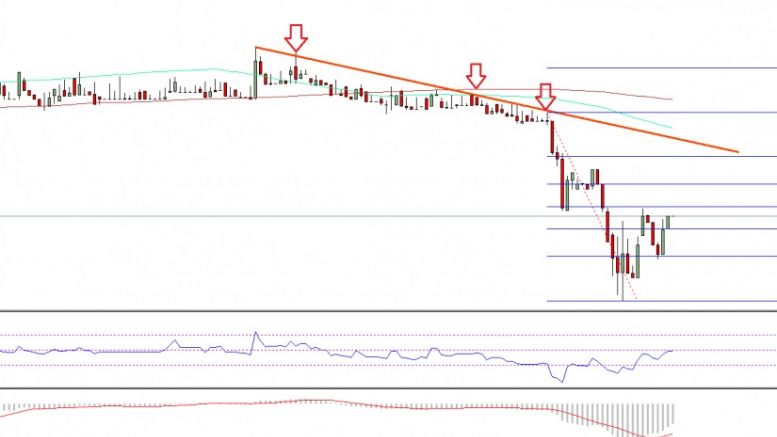
Ethereum price registered heavy losses and even closed below the $12.00 handle against the USD. Can the price recover moving ahead? Key Highlights. Ethereum price dived sharply against the US Dollar, and one of the main reasons could be Ethereum classic price surge. Yesterday’s highlighted bearish trend line on the hourly chart (data feed via Kraken) of ETH/USD acted as a perfect barrier in pushing the price down. There was a heavy bearish pressure noted on ETH/USD, which could stay here for some time. Ethereum Price Weakness. Ethereum price ETH was under a lot of bearish pressure during....