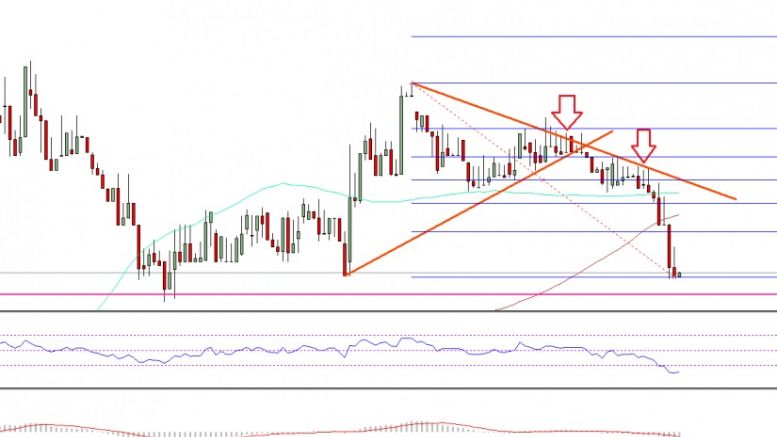
Ethereum Price Technical Analysis – ETH/USD Breaks Down
Key Highlights. ETH price failed to gain traction against the US Dollar, and broke a short-term bullish trend. Yesterday’s highlighted connecting bullish trend line on the hourly chart (data feed via SimpleFX) of ETH/USD failed to hold the downside. The pair is approaching a major support area at $7.85 where buyers may appear. Ethereum price failed to gain momentum against the US Dollar and Bitcoin. It looks like the ETH/USD is positioned for a test of $7.85. Ethereum Price Downside Break. Yesterday, I was hoping for a minor bounce in ETH price versus the US Dollar. However, there was no....
Related News

A crypto analyst, who publishes technical analysis to his audience on X, has released a zoomed-out weekly Ethereum chart that interprets the current price weakness as the final stage of a multi-year accumulation cycle. As it stands, the Ethereum price is trading around $2,100 and 57% below its peak. Therefore, the technical analysis is suggesting that […]

Ethereum has started to show signs of life again after weeks of muted price action, but one analyst believes the current move is only the beginning of something much larger. This inclination is based on a technical setup built around a hidden inefficiency zone after the Ethereum price recently broke above $4,500. The technical analysis shows that the unfilled gap may be the first waypoint in a recovery that eventually pushes the ETH price to five figures above $10,000. The FVG Zone Now Acting As A Magnet Technical analysis done by crypto analyst Crypto Patel laid out a path to where the....
The final months of a market cycle are usually characterized by exhilarating runs by various assets in the altcoin market — a period famously dubbed the “altcoin season.” Unfortunately, while the market cycle seems to have peaked, the story has been the opposite for this category of cryptocurrencies. Specifically, the Chainlink price has declined by more than 50% in the last three months, underscoring the dwindling climate of the crypto market. However, the future might not be all bleak, as the latest price outlook suggests a promising future for the LINK token. Is Chainlink Price Gearing....
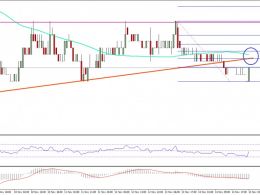
Ethereum classic price once again failed to retain the bullish momentum against the Bitcoin, and moved down below the 0.00121BTC support area. Key Highlights. Ethereum classic price consolidating for some time against the Bitcoin breaks a short-term support area. Yesterday’s highlighted bullish trend line on the hourly chart of ETC/BTC (data feed via Simplefx) was broken to ignite a downside move. The broken trend line support at 0.00121BTC may now act as a resistance. Ethereum Classic Price Resistance. ETC price again failed to climb higher, as the 0.00127BTC resistance against the....

Litecoin has tumbled roughly 5 percent as Bitcoin went weak and has neared the downward sloping support. In the previous Litecoin price technical analysis titled Breaks Out, Buy Near Support, I mentioned that any pressure on Bitcoin will get reflected in Litecoin as well. It was also stated that the support of $3.820 should prevent immediate losses. As can be seen, the cryptocurrency touched an intraday low of $3.820 before retracing. Technical analysis of the daily LTC-USD price chart and the action in the Bitcoin market compel me to be only cautiously optimistic on Litecoin. Litecoin....