
XRP Price Gains Traction — Buyers Pile In Ahead Of Key Technical Breakout
XRP price started a fresh increase above $2.45. The price is now showing positive signs and might rise further if it clears the $2.680 resistance. XRP price is attempting a fresh increase above the $2.50 zone. The price is now trading above $2.50 and the 100-hourly Simple Moving Average. There is a bullish trend line forming with support at $2.580 on the hourly chart of the XRP/USD pair (data source from Kraken). The pair could start a fresh increase if it clears the $2.680 resistance. XRP Price Eyes Steady Increase XRP price formed a base above $2.320 and started a fresh increase, like....
Related News

Dogecoin Price Key Highlights. Dogecoin price has been trading below a long-term descending trend line for quite some time, but reversal signals are showing up. Price made a sharp upside breakout, hinting that the downtrend might already be over and that it's time for buyers to take charge. Dogecoin price could be in for more gains, as it made a convincing breakout from the descending trend line connecting its latest highs. Waiting for Technical Confirmation. Technical indicators have yet to confirm the dogecoin price rally since the 100 SMA remains below the 200 SMA for now. This suggests....
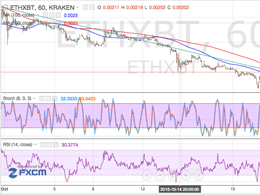
Ethereum Price Key Highlights. Ethereum price had been trending steadily lower on long-term and short-term time frames, but an upside break from the descending trend line on the 1-hour chart suggests that a reversal might be in order. Price popped above the moving averages to a high of 0.00237BTC and has since retreated for a retest of the broken resistance. Ethereum price may be on the verge of a reversal from its earlier downtrend, indicated by the trend line breakout on a short-term chart. Sights Set on Next Resistance. If the uptrend gains traction, ethereum price could head up to the....
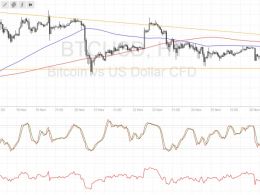
Bitcoin price is still stuck inside the triangle consolidation pattern but might be gearing up for a breakout soon. Bitcoin Price Key Highlights. Bitcoin price has formed lower highs and found support around $730, creating a descending triangle pattern. Price just bounced off support and might be ready for a test of resistance at $750-755. Technical indicators seem to be hinting that the resistance would hold, although a breakout is possible with this week’s event risks. Technical Indicators Signals. The 100 SMA is below the longer-term 200 SMA so the path of least resistance is still to....
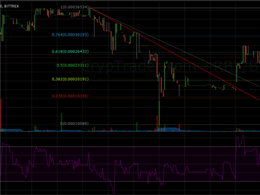
Key Highlights. Rubycoin price managed to break a major resistance area to set the tone for more gains in the near term. There is a bearish trend line break noted, which encouraged the buyers to take the price higher. More upsides are possible, as there are many positive signs emerging on the hourly chart for bulls. Rubycoin price surged higher, broke a critical bearish trend line and looks set for more gains moving ahead. More Gains Ahead? The Rubycoin price enjoyed a decent run towards the upside, and also cleared a major bearish trend line on the hourly chart. The mentioned break was....

In a significant move for the SUI market, bulls have successfully broken out of a key technical chart pattern, setting their sights on the next major resistance level at $3.50. This breakout signals a shift in momentum, as the price action re-establishes a clear upward trend. Technical Setup Signals Room For Further Upside Crypto VIP Signal, in a recent update on X, highlighted that SUI has sustained its bullish momentum exactly as anticipated, successfully breaking out of the falling wedge pattern. This breakout is a strong technical signal often associated with trend reversals,....