
What April Could Mean For XRP: Past Patterns And Key Price Catalysts To Watch
XRP began April sitting above the key support level at about $1.30, yet the token remains well below where it opened the year. Historically, however, April has been one of altcoin’s strongest months, and a mix of on-chain data and a potentially decisive legislative event this month could result in a new turnaround. What Past Aprils Say About This Year’s Odds Market analyst Sam Daodu laid out the historical performance in a new report, noting that since 2014 April has produced an average return of 24.8% for XRP. On that metric, a rally of similar size from the current level near $1.34....
Related News
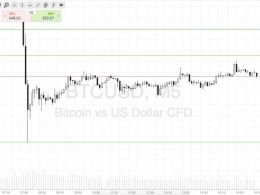
Here's a look at what we are focusing on in the bitcoin price this evening. In this morning’s bitcoin price watch analysis, our primary focus was a tight range, and a strategy that involved using some scalp breakout targets to take advantage of that range. We noted that given recent action (volatile, but only short term, and only on the smaller time frames) we would likely need to maintain this type of scalp strategy for the foreseeable future – at least until things picked up fundamentally. We haven’t really had any major fundamental catalysts as late, and this has translated to some....

A crypto analyst has shared a new Bitcoin price roadmap, outlining where the market currently is and projecting the cryptocurrency’s next moves amid the ongoing bear market. While some experts still see more downside ahead for BTC, this analyst predicts a massive surge back above $90,000. The analyst cites several catalysts, including Bitcoin price action […]

XRP ended April with momentum, posting gains of roughly 9.4% over the month. Still, the bigger question for traders is whether the next leg can come faster—and push the altcoin beyond the narrow consolidation zone that has defined much of its recent trading. According to market expert Sam Daodu, May has unusually strong timing and catalysts stacked together that could lift XRP to price levels not seen since the start of the year, especially if a key piece of US crypto legislation progresses as expected. May Catalyst Watch Daodu points to a current consolidation range for XRP between $1.30....
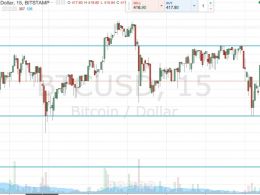
There have been a few fundamental catalysts that have added strength to bitcoin this week, and these are likely to slow down over the weekend. After a solid week of gains in the bitcoin price, we are seeing some choppy action come about as we head into the weekend. This isn’t necessarily a bad thing – the opportunity to get in on some volatility means we can pick up a decent entry – but it makes things a little more complicated than the step up approach we have been using for the past few days. There have been a few fundamental catalysts that have added strength to bitcoin this week, and....
Bloomberg senior strategist Mike McGlone has renewed a stark prediction for Bitcoin (BTC), arguing that the market’s leading cryptocurrency could resume a prolonged decline that takes it back toward $10,000. Why McGlone Sees Bitcoin Heading Back To $10K In a Thursday post on social media platform X (previously Twitter), McGlone framed the $10,000 level as a long-standing reference point for Bitcoin: it was a common trading price before the 2020–21 rally and has been among the most frequently traded levels since futures began trading in 2017. McGlone’s view, which he describes....