
Bitcoin Aims Higher as Bulls Regain Strength and Push for Resistance Break
Bitcoin price started a fresh increase above $90,500. BTC is now consolidating gains and might attempt an upside break above $91,650. Bitcoin started a fresh increase above the $90,500 zone. The price is trading above $91,000 and the 100 hourly Simple moving average. There was a break above a key bearish trend line with resistance at $90,000 on the hourly chart of the BTC/USD pair (data feed from Kraken). The pair might continue to move up if it settles above the $91,650 zone. Bitcoin Price Faces Resistance Bitcoin price managed to stay above the $90,500 zone and started a fresh increase.....
Related News

Solana (SOL) has recently pulled back to the $137 level, a key point that could dictate its next move in the market. As the cryptocurrency tests this resistance, market participants are watching closely to see if the bears will seize the opportunity to drive prices lower, or if the bulls will capitalize on this pullback to ignite a breakout. This article aims to analyze Solana’s recent pullback to the $137 level and assess whether the bears can regain momentum to push the price lower or if the bulls will leverage this moment to drive a breakout. By examining key technical....
Injective Protocol (INJ) has had a tough time seeing its price shed over 90% from its all-time high of $24.8 against tether (USDT). Despite recently seeing a huge pullback in the crypto market, Injective Protocol (INJ) continues to show immense strength, racking up double-digit gains. (Data from Binance) Related Reading: NEAR Bulls Charge Their Way Past $4.7 Amid Lack Of Spike In Volume Injective Protocol (INJ) Price Analysis On The Weekly Chart INJ saw a decline in its price from $24.8 to around $0.9, with an over 90% drop from its all-time high despite having good fundamentals. The....
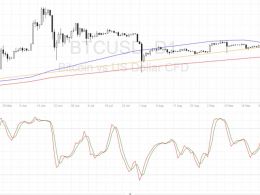
Bitcoin price could be due for more gains after this upside breakout, possibly aiming for the $750 level next. Bitcoin Price Key Highlights. Bitcoin price made a strong upside break of the near-term resistance marked in a previous article. This suggests that bulls are gaining strength and could push price to the next ceiling. At the moment, bitcoin is testing the area of interest at $700, which is a major psychological level. Technical Indicators Signals. The 100 SMA is above the longer-term 200 SMA so the path of least resistance is to the upside, even on this daily chart. However, the....
BEL price creates more bullish sentiment as price struggles to break and hold above the daily 50 EMA BEL looks more stable as bulls breakout of a descending triangle The price of BEL could face major resistance at $1 Bella Protocol (BEL) had a rocky start to the year, failing to live up to its initial hype. However, this could be set aside as the price has recently turned bullish against tether (USDT). Bella Protocol (BEL) has seen more of a downtrend than an upside in the bear market, with the price struggling to regain the bullish structure and failing each time, with Bitcoin (BTC)....
Ethereum prices surge from the low of $980 to a high of $1,743 with so much excitement as regards the merge coming up in a few weeks. With the monthly close, there have been high expectations for the Ethereum price to reach a region of $2,000 -$2,400. Ethereum Weekly Chart The Ethereum price surged from the low $1,012 to $1,743 after several weeks of a downtrend. There was a bit of relief bounce from Ethereum haven traded below the 50 & 200 Exponential moving average (EMA). Ethereum, as of writing, is trading at $1,580 after being rejected at $1,722; Ethereum could not break the weekly....