
Bitcoin Price Bounce Weakens, Downside Risks Begin Rising Again
Bitcoin price started a recovery wave above the $76,800 zone. BTC is consolidating and might aim for more gains if it clears the $78,300 resistance zone. Bitcoin managed to form a base above $76,000 and started a recovery wave. The price is trading above $77,200 and the 100 hourly simple moving average. There was a break above a bearish trend line with resistance at $77,200 on the hourly chart of the BTC/USD pair (data feed from Kraken). The pair might gain bullish momentum if it settles above the $79,000 zone. Bitcoin Price Eyes Fresh Upside Break Bitcoin price remained supported above....
Related News

XMR is also nearing a breakdown move led by the formation of rising wedge, a classic bearish reversal pattern. Monero (XMR) price may witness a sharp pullback by June because its 75% rally in the last two weeks has left the gauge almost "overbought."Monero price RSI meets rising wedgeDownside risks have been mounting due to XMR's relative strength index (RSI), which almost hit 70 this May 23, indicating that the market is considered overvalued. An oversold RSI could amount to a bout of declining moves, as a rule of technical analysis.Additionally, Monero is also painting a bearish reversal....
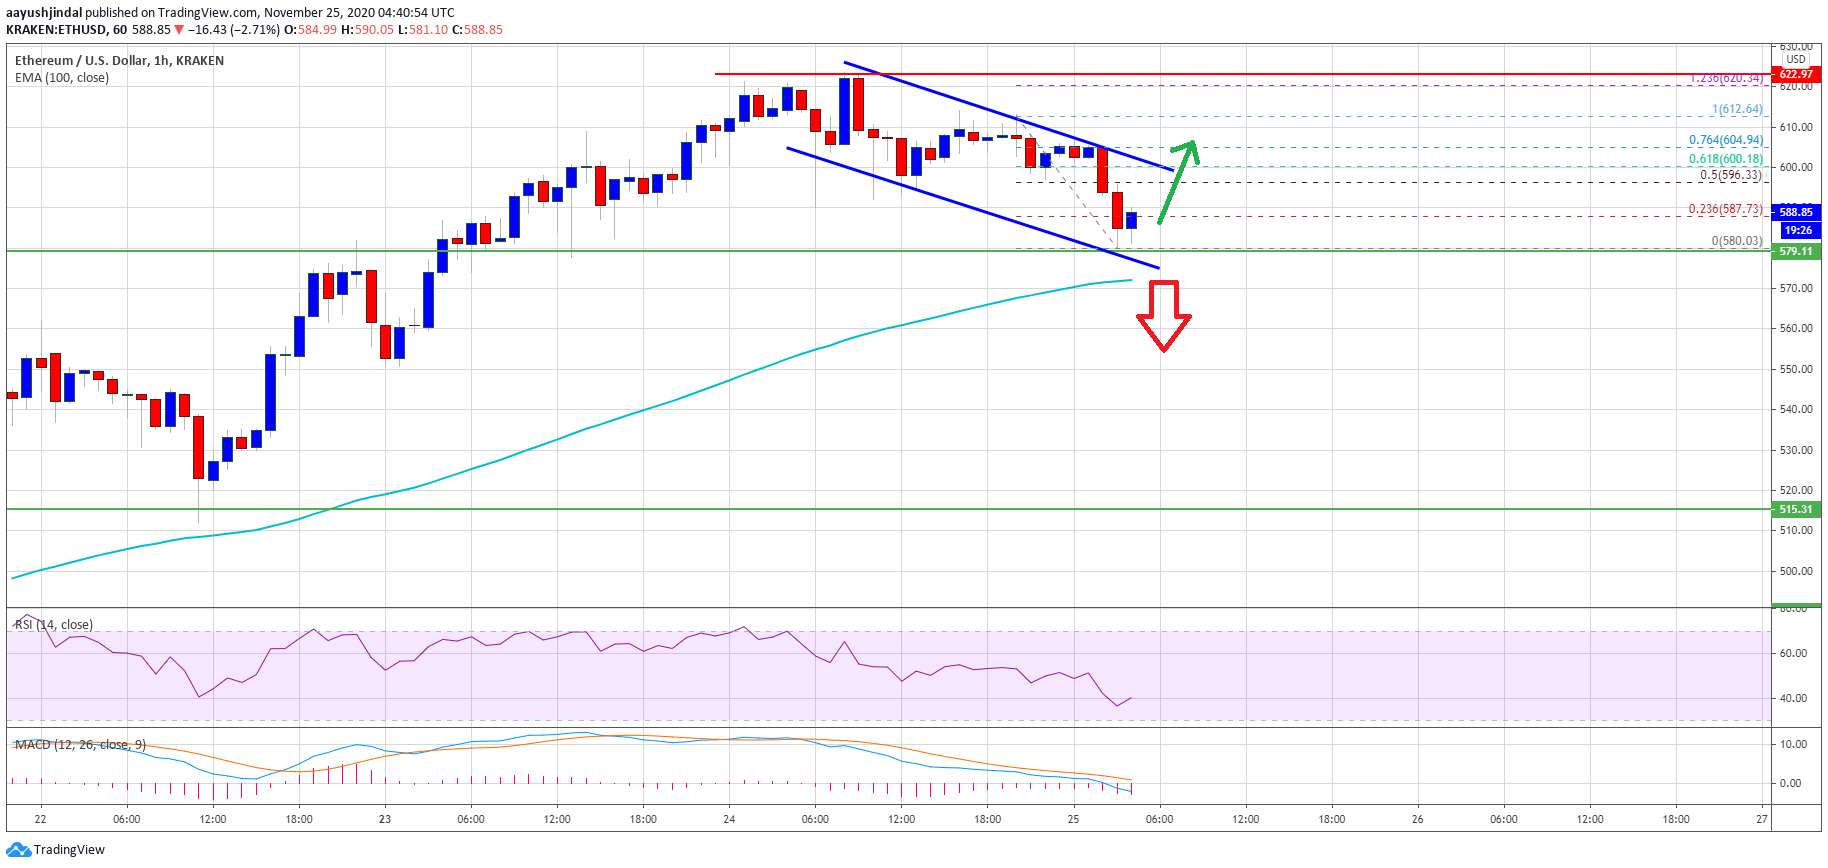
Ethereum started a downside correction from the $620 zone against the US Dollar. ETH price is now trading near a major support at $580 and the 100 hourly SMA Ethereum started a downside correction after it failed to clear the $620 and $625 resistance levels. The price traded below the $600 support, but it is […]

More bearish cues for SOL comes from a bull flag setup that's now breaking to the downside. A rebound move witnessed in the Solana (SOL) market this weekend exhausted midway as its price dropped below the $90 level from a high of $96 on Feb. 21. In doing so, SOL price technicals are now risking a classic bearish reversal setup.Solana price risks dropping to $60Dubbed head-and-shoulders (H&S), the technical pattern emerges when the price forms three peaks in a row atop a common support level (called a neckline). As it typically turns out, the pattern's middle peak, called a "head," comes....

Ethereum Price Key Highlights. Ethereum price is gradually trending higher but there are still some signs of consolidation, creating a rising wedge pattern on its 1-hour time frame. Price is currently hovering near the wedge support, as buyers and sellers try to decide whether a bounce or a break is in order. Ethereum price is still picking a direction, with a slight bias to the upside, as bitcoin price is also under a bit of selling pressure. Potential Resistance at 0.00300? A bounce off the wedge support around 0.00260 could lead to a move up to the top of the pattern just past the....
Bitcoin price appears to be trading inside a rising wedge pattern on the 4-hour chart and is currently testing the bottom. Bitcoin Price Key Highlights. Bitcoin price hasn’t made much headway north after pulling back to a nearby support zone. Price seems to be moving inside a rising wedge pattern, as buyers are trying to push higher while sellers are also putting up a strong fight. Technical indicators are hinting that further gains are in the cards for bitcoin price. Technical Indicators Signals. The 100 SMA is above the longer-term 200 SMA on this time frame so the path of least....