
Solana (SOL) Dips Into the Red – Healthy Correction or Trend Reversal?
Solana started a fresh decline from the $200 zone. SOL price is down over 10% and might even struggle to stay above the $175 support zone. SOL price started a fresh decline below the $200 and $185 levels against the US Dollar. The price is now trading below $185 and the 100-hourly simple moving average. There is a connecting bearish trend line forming with resistance at $182 on the hourly chart of the SOL/USD pair (data source from Kraken). The pair could start a fresh increase if the bulls clear the $185 zone. Solana Price Dips Further Solana price struggled to clear the $205 resistance....
Related News

Ethereum price is at a stage of forming a hidden reversal of a long-term downward trend. The price is still in the area of high volatility. ETH/USD. Ethereum’s rebound from $10.5 can provoke an increase in volatility. Such a development of the upward trend can indicate a possible hidden reversal. That reversal is taking place at a subwave level when there is a clear advantage of one group of traders over the other. Two possible course of events. Break through $11.7 mark and continuation of growth towards $20. A confirmation of this scenario would be a fortification of Ethereum price above....
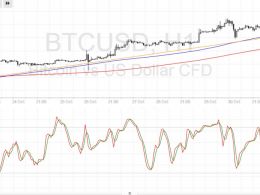
In yesterday's market session, bears came charging down on Bitcoin causing a 1.66 percent drop in the price and pushing it below the $240-mark. At $239.03, Bitcoin is now in close proximity to the support provided by the horizontal line and is currently sustaining at the 30-day SMA OF $236.9643. However, the correction is not surprising given the number of resistances that Bitcoin has to cross if it is to reach its target of $260. But, is this correction an opportunity that market participants should pounce on, or is it signaling a short-term trend reversal? Let us find out through the....

Bitcoin has shown signs of stabilization following its earlier correction this month, which saw the asset fall to as low as $74,000. Over the past week, Bitcoin has rebounded strongly, gaining nearly 10%, and now trades above $84,000. This upward movement has reignited optimism among investors, though some analysts remain cautious about calling this a definitive trend reversal. Related Reading: Bitcoin’s Last Drawdown To $74,000 A ‘Healthy Correction’ — Analyst Says Bull Cycle Is Still On Apparent Demand Shows Recovery, But Trend Reversal Uncertain According to recent on-chain data, the....

The Bitcoin price is hovering above $17,700 after an explosive overnight rally. Albeit the market sentiment is at its peak, some traders anticipate a healthy BTC price pullback might occur. Michael van de Poppe, a full-time trader at the Amsterdam Stock Exchange, said an average 30% correction would mark a healthy pullback for BTC. If […]
Bitcoin price is in for another dip to the ascending trend line support, offering an opportunity to buy on dips. Bitcoin Price Key Highlights. Bitcoin price made a strong rally after its bounce off the rising support, as indicated in an earlier article. The $740 area is holding as resistance, possibly spurring another potential correction to the ascending trend line support. Technical indicators are suggesting that the uptrend could continue but that profit-taking is due. Technical Indicators Signals. The 100 SMA is above the longer-term 200 SMA on this time frame so the path of least....