
Bitcoin Is Now Above This Historical Level, But For How Long?
Bitcoin is now above a certain historical on-chain metric, and if the asset can continue to hold here, a bullish trend might follow. Bitcoin Is Now Above The “Warm Supply” Realized Price As explained by an analyst in a post on X, BTC is now trading above the warm supply realized price. The “realized price” […]
Related News
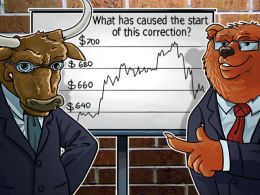
Bitcoin’s price is undergoing a correction toward the long-term upward trend. For how long will this correction last, and at which point is the long-term upward trend most likely to continue? What has caused the start of this correction? One of the key long-term levels was near $760-80. A long-term downward trend has been forming along that price as far back as 2014. The price of $760-80 has become a key level. The placing of the correction level of the Fibonacci grid 38% has given more significance to that range. That’s why it could be called a historical maximum, which was later....

Bitcoin’s long-term price structure is once again drawing attention, as the asset continues to follow a powerful historical pattern on the monthly timeframe. Despite short-term volatility and shifting market sentiment, the broader trend suggests BTC may still be tracking well-established cyclical behavior from previous market phases. How Historical Bitcoin Data Supports A Positive May Outlook […]
Bitcoin is approaching a price level that has, without exception, led to the absolute bottom of every major bear market cycle in its history, and on-chain indicators show the moment of maximum opportunity may be drawing near for Bitcoin traders to capitalize on an incoming rally. Bitcoin’s Historical Bottom At The 200-Week Moving Average One […]

Litecoin painfully and slowly tracks the Bitcoin correction. There was a strong reduction of the Litecoin price to $3.40 - $3.50; the exchange rate of 0.008 was not maintained, and Litecoin promptly slid to 0.0077 and lower. When will this movement stop? At the level of 0.0075 or maybe at the historical level of 0.006? The DASH price seeks to break free of its local bottom, which became even lower recently at 0.00558. Buy orders below this level are interesting; a long-term reduction of the price to a bottom of 0.0056 will provide an opportunity to interrupt this down-trend.

Cardano is testing a key long-term support at $0.25 once again, a level that has repeatedly sparked strong upside reversals in past cycles. With historical reactions from this zone leading to major rallies, the current reaction could mark the early stages of another structural move higher if support continues to hold. $0.25 Emerges As Cardano’s Most Critical Support Level According to analysis by Ali Charts, the $0.25 price point has emerged as the most critical support level for ADA. By examining the monthly chart, the analyst highlights that this specific price floor has historically....