
Bitcoin Bounces Off Historic “Mayer Multiple” Bottom Zone
Data shows the price of Bitcoin has broken above the 0.55 Mayer Multiple level, below which the crypto has historically formed bottoms. Bitcoin Has Now Left The Zone Below 0.55 Mayer Multiple As per the latest weekly report from Glassnode, the BTC price has escaped above the Mayer Multiple bottom zone. The “Mayer Multiple” is an indicator that measures the ratio between the current Bitcoin price and the 200-day moving average of the same. A “moving average” (or MA in brief) is an analytical tool that takes the average of any quantity over a specified period, and as....
Related News
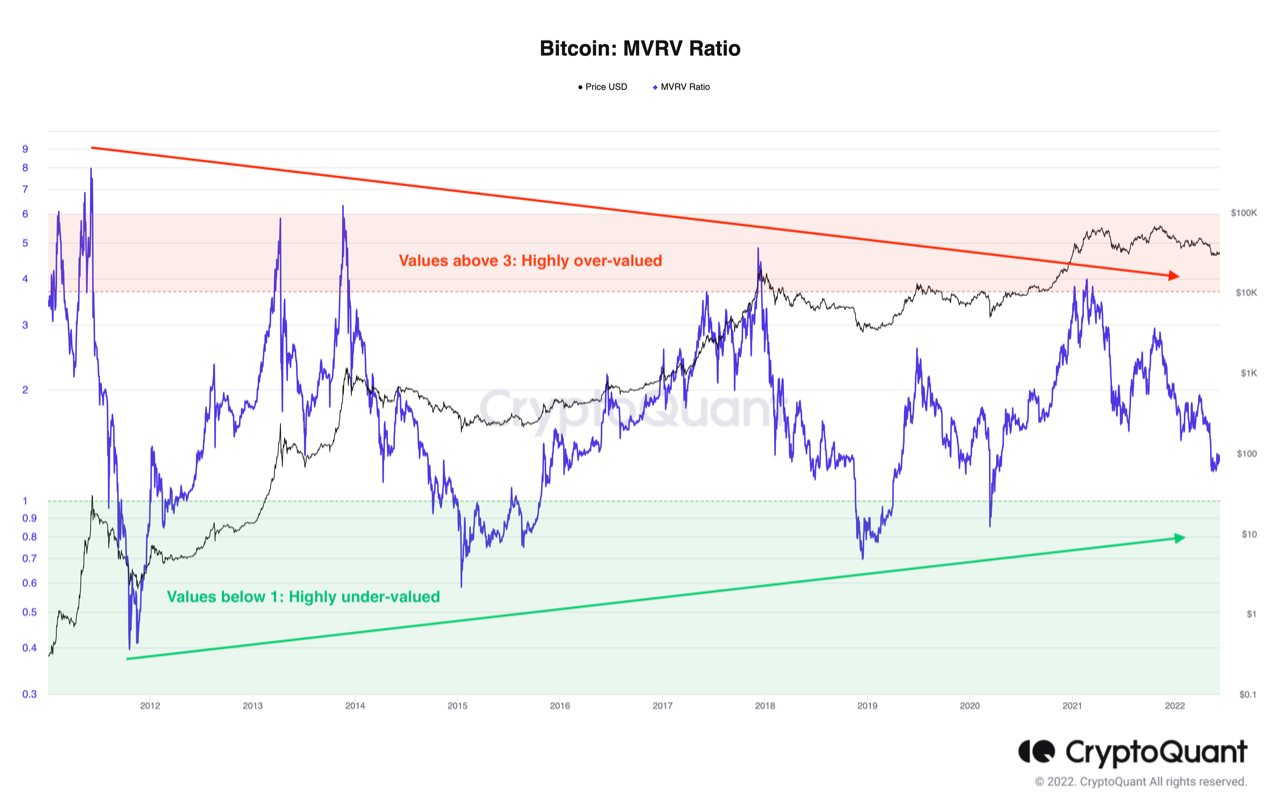
Data shows the Bitcoin MVRV ratio has gone down recently, but the metric’s value is still above the historic bottom zone. Bitcoin MVRV Ratio Observes Decrease, But Value Still Greater Than 1 As explained by an analyst in a CryptoQuant post, BTC may still have room for further decline before the bottom is in. The […]

The XRP price fell as low as $2.0238 on Monday, potentially forming a local bottom. Since then, the XRP price is up almost 6%, however, the possibility of a deeper retracement remains. Two prominent chartists—CasiTrades (@CasiTrades) and Charting Guy (@ChartingGuy)—have shared their perspectives on whether the token has found its local bottom or if further downside might still be on the table. Is The XRP Price Bottom In? According to CasiTrades’ newly published chart, XRP appears to have tested the 0.786 Fibonacci retracement at $2.05 and is now showing bullish divergences across multiple....

Ethereum ($ETH) just slipped into what analysts are calling a historic buy zone. Its price dipped below a key level that’s acted as support during some of the market’s biggest rebounds. For seasoned crypto investors, this zone isn’t a red flag – it’s an invitation to accumulate before the next move. At the same time, […]

Bitcoin accumulation is in full swing during the downtrend despite BTC price having more room to drop. A Bitcoin (BTC) on-chain indicator, which tracks the amount of coin supply held by long-term holders (LTHs) in losses, is signaling that a market bottom could be close.Eerily accurate Bitcoin bottom punditAs of Sept. 22, approximately 30% of Bitcoin's LTHs were facing losses due to BTC's decline from $69,000 in November 2021 to around $19,000 now. That is about 3%–5% below the level that previously coincided with Bitcoin's market bottoms.For instance, in March 2020, Bitcoin price declined....
On-chain data shows the percentage of the Bitcoin supply aged between one week and one month old has now declined to the historical bottom zone. Only 3.8% Of The Total Bitcoin Supply Is Now In The 1 Week To 1 Month Old Bracket As pointed out by an analyst in a CryptoQuant post, short-term buying […]