
XRP Price Turns Red as Bulls Step Back and Bears Test Market Strength
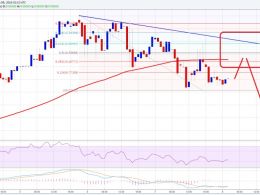
XRP price started a fresh decline from $2.550. The price is now showing bearish signs and might extend losses if it dips below $2.250. XRP price started a fresh decline below the $2.450 zone. The price is now trading below $2.40 and the 100-hourly Simple Moving Average. There is a short-term contracting triangle forming with resistance at $2.235 on the hourly chart of the XRP/USD pair (data source from Kraken). The pair could continue to move down if it settles below $2.250. XRP Price Dips Further XRP price attempted more gains above $2.50 but failed to continue higher, like Bitcoin and....
Related News

Litecoin price had been staggering too, just like other major altcoins in the market. Over the last 24 hours, however, LTC moved up on its chart by 2.4%. The bulls have yet to steady themselves on the one-day chart. Over the last week, LTC gained almost 3%. This indicated that the coin has not made any such considerable movement on its chart. The bears were in charge of the altcoin, as indicated by the technical indicators. There is a significant immediate resistance for the Litecoin price to overcome. The buyers were low in the market, and that has tired the bulls out consistently. At the....
Bitcoin price is back at $46,000 after a few month reset back to $30,000 and slightly below. A more than 50% collapse from the current all-time high of $65,000 had the cryptocurrency community calling for a bear market, but according to a trend strength indicator, bears are nowhere in sight. In fact, the tool, called the Average Directional Index suggests that bulls are now back in control over Bitcoin price action on every major timeframe. Bitcoin Ready For Final Push According To ADX Indicator Bitcoin is an unusually bullish asset that has only truly known a secular bull market despite....
Bitcoin stands at a critical crossroads, with its price hovering near the crucial $93,257 support level. This key price point has acted as a stronghold for the cryptocurrency during its recent ascent, but now, the market is facing mounting pressure. Bearish strength is starting to gain traction, raising concerns that the $93,257 level might soon give way to further declines. The Relative Strength Index (RSI) is beginning to show signs of weakness, suggesting that momentum is shifting in favor of the bears. If Bitcoin fails to hold this support, it could trigger a wave of sell-offs, pushing....

Bitcoin is back below $60K, and could be in trouble for the first time since early last year. And while most agree the bull market isn’t over, the short term trend has now been taken over by bears according to one technical indicator. The tool itself measures the strength of both sides of the coin, […]
Ethereum price traded down finally and also moved back below $10.0. It looks like there is a chance of a minor correction moving ahead. Intraday Support Level can be $9.07. Intraday Resistance Level may be $10.5. Ethereum price as highlighted yesterday made a new high of $11.98 where it found sellers and started to move down. The price also traded below the $10.0 level, which is a sign that bulls stepped back and failed to prevent losses. If the bears manage to gain strength, then there is a chance of more losses in the near term.