
Bitcoin Must Close Above $107,000 To Confirm Breakout Or Risk Dropping To $98K
After a powerful rally earlier this month, Bitcoin’s price action has stalled just above $103,000 and has been caught in a tight consolidation range for over the past week. The daily chart shows consistent resistance just above $107,000, with the latest candles forming in a compressed horizontal band, indicating indecision and low momentum. Related Reading: ‘Judgment Day Is Coming’—XRP Set To Explode, Analyst Warns This price behavior could be seen as a pause before the next leg higher. However, it could also be a trap that could cause a reversal towards $98,000. Daily Close Above $107K A....
Related News

Bitcoin’s price action around the $70,000 region is beginning to look like the start of a breakout. Bulls are watching closely for a close above the $70,000 resistance that could signal a new upward leg. At first glance, that outcome appears positive. A breakout and weekly close above $70,000 would seem to confirm strength after […]

Bitcoin is approaching a critical tipping point as two powerful bullish patterns, the Cup & Handle and the Inverse Head and Shoulders, align to signal a potential breakout storm. With momentum building and key resistance levels now within reach, the market is bracing for what could be a major explosive move. BTC Climbs Above 93,160 As Cup & Handle Targets 104,000 Charting BTC on the 4-hour timeframe, analyst Kamile Uray revealed that the price is currently moving above the $93,160 level. Uray is closely monitoring the price, as a successful close above this level would confirm the breakout....

Bitcoin’s range breakout boosted sentiment but traders are waiting for a daily close above $41,000 before taking more decisive action. Bitcoin started the week with a strong breakout to $40,900, but today bulls are trying to hold Bitcoin price above the $40,000 level. As the price broke from the $31,000 to $39,000 range on June 14, traders speculated that setting a daily higher high and a close above $41,000 would set BTC up for a move to $47,000, but a lack of sustained buy volume and the much-discussed possibility of a death cross between the 50- and 200-day moving average are factors....
With the Ethereum price struggling around the $2,000 support, the question of when the digital asset will hit a bottom has continued to linger among investors. Naturally, a bottom is largely based on the Bitcoin price, setting the tone for the entire market. However, a crypto analyst has also suggested things to look out for that could help to confirm that the Ethereum price has actually hit a bottom and will begin to move upward once again. Watch Out For The Ethereum Close Above $2,100 For now, the Ethereum price is still trending below $2,100, and crypto analyst Rawl has called this out....
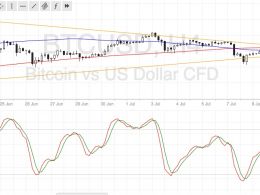
Bitcoin price could be due for a strong break out of its consolidation pattern, but traders still seem to be undecided which way to push. Bitcoin Price Technical Analysis. Bitcoin price is still stuck in its consolidation pattern visible on the 4-hour time frame. Price is already at the peak of the symmetrical triangle formation, which means that a breakout could take place anytime now. Technical indicators and market sentiment appear to be hinting at a downside break. Technical Indicators Signals. The 100 SMA is below the 200 SMA so the path of least resistance is to the downside. A....