Shiba Inu Trapped Inside Triangle: 17% Move Incoming?
An analyst has pointed out that Shiba Inu is currently trading within a triangle pattern, which could set up a 17% move for the memecoin. 4-Hour Price Of Shiba Inu Has Been Consolidating Inside A Triangle Recently In a new post on X, analyst Ali Martinez has talked about a pattern that has been forming on the 4-hour chart of Shiba Inu recently. The pattern in question is a triangle from technical analysis (TA). This type of channel emerges when the price of an asset observes consolidation between two trendlines that converge at some common point. The upper line of the pattern is likely to....
Related News
Shiba Inu has spent the past several days trading in a downward path after a failed breakout attempt above $0.000015 earlier this month. Despite the cautious sentiment among investors, Shiba Inu’s chart structure on the 2-day candlestick timeframe is pointing to an interesting structure. Related Reading: Shiba Inu Completes Bullish Setup: Why A 138% Climb Could Be In The Works A technical analysis by crypto analyst Jonathan Carter highlights a descending triangle formation that could set the stage for a strong bullish move. The setup suggests that if support holds, SHIB could be preparing....
An analyst has pointed out how Dogecoin is consolidating within a triangle pattern that could set up a 40% move for the memecoin’s price. Dogecoin Is Trading Inside A Symmetrical Triangle Pattern In a new post on X, analyst Ali Martinez has talked about what the triangle that Dogecoin’s 12-hour price is trading inside right now could foreshadow for it. A triangle is a consolidation channel in technical analysis (TA) that forms whenever the price of an asset trades between two converging trendlines. Related Reading: Bitcoin Bullish Signal: Sharks & Whales Are Buying The Dip The....
An analyst has pointed out how a 78% price move could be coming for Pepe based on a technical analysis (TA) pattern forming in its daily chart. PEPE Is Approaching The End Of A Symmetrical Triangle In a new post on X, analyst Ali Martinez has shared a TA pattern forming in the 1-day price of Pepe. The pattern in question is a “Symmetrical Triangle,” which forms when an asset observes consolidation between two trendlines approaching each other at a roughly equal and opposite slope. The upper line of the pattern acts as a resistance barrier, while the lower one provides support.....
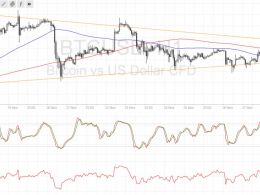
Bitcoin price is still staying inside the consolidation pattern for now but could be ready to break out as it approaches the peak of the formation. Bitcoin Price Key Highlights. Bitcoin price is still stuck in consolidation, moving inside a symmetrical triangle formation as illustrated in an earlier article. Price just bounced off the triangle support after a number of tests and is now making its way to the top. Technical indicators seem to be suggesting that a downside breakout is due. Technical Indicators Signals. The 100 SMA is below the longer-term 200 SMA, which means that the path of....
XRP has been declining over the past few days, making a retest of this Descending Triangle’s lower boundary possible, according to an analyst. XRP Has Been Moving Inside A Descending Triangle Recently In a new post on X, analyst Ali Martinez has talked about where XRP may be heading next, based on a Descending Triangle. This technical analysis (TA) pattern forms when an asset’s price witnesses consolidation between two converging trendlines. The main feature of the pattern is that its lower trendline is parallel to the time-axis. This level acts as a support boundary, while the....


