

Bitcoin Shows Early Trend Reversal Signs After Major Support Hold
Bitcoin is showing early signs of recovery after firmly holding a major confluence support zone. The strong reaction from this level suggests that buyers have stepped in to absorb selling pressure. With the market beginning to stabilize, attention is now turning to whether this defense could mark the start of a broader bullish reversal. How Bitcoin Defends Major Confluence Zone Bitcoin has successfully defended a major confluence zone and is beginning to show early signs of recovery. According to Cryptorphic, after consolidating around the 200-week EMA and the Weekly Fair Value Gap between....
Related News

Avalanche (AVAX) struggles to hold above key support that will set the tone for a rally to the $40 mark region anticipated by many. The price of Bitcoin (BTC) saw a retracement as it could not break and hold above important support that corresponds with the daily 50 exponential moving average (EMA). BTC’s unable to hold that region has led to AVAX struggles to form good support. Avax Weekly Chart Analysis The weekly chart for Avax shows a downtrend reversal to a low of $16.3, where buyers were more willing to step into the market. The chart shows the price of Avax needs to break and....
XRP may be entering a more constructive phase, according to a new thread via X from market analyst Ali Martinez (@alicharts), who argued on April 21 via X that the asset is showing a “structural trend shift from bearish to bullish.” The case rests on a mix of trend-following indicators, whale accumulation, exchange supply dynamics, and a tightening chart structure that could set up a larger move. 4 Signs XRP Is Turning Bullish Ali’s first signal is a change in the macro trend on the daily chart. In the thread, he said the SuperTrend indicator has now issued its first buy signal since....

Bitcoin price is back now at the mid $30,000 range after a quick plunge below $30,000 support this week. The short lived dip below support finally resulted in a worthwhile bounce, leaving behind a reversal signal that in the past has had god-like results. If crypto bulls can hold at current prices by the time the […]
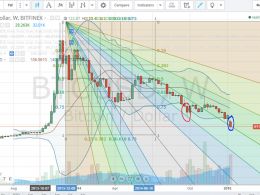
After testing the $200 critical support point, the price of bitcoin dropped today to around $170, before rising up again to $191 at the time of writing of this article. By drawing a trend line between the high reached on the 3rd of December, 2013 ($1177) and the low reached on the 10th of February, 2014 ($102) and plotting the Fib Speed Resistance Fan on the daily BTC/USD charts, we can see the price bouncing off the 0.61 fan line in last October (the red circle on the above chart) and as of today, the price touched the 0.5 fan line (the blue circle on the above chart), which is considered....

Bitcoin price surged past $11,000 and 3 key indicators suggest a strong trend reversal is underway. Within the last few hours, Bitcoin (BTC) price surpassed $11,000 in a swift turnaround from its swing low at $10,500 in early October. Analysts have attributed three major factors to BTC’s abrupt trend reversal.The potential catalysts are whale accumulation, a spike in institutional demand, and the strength of the $10,500 support.Whales are either accumulating or refusing to sellEarlier this week, Cointelegraph reported that activity within whale clusters pointed to strong buying demand from....