
XRP Price Pauses After Rally – Can Bulls Hold Ground For Another Push?
XRP price extended gains above $3.00 and $3.050 before correcting gains. The price is now consolidating gains and facing hurdles near the $3.050 level. XRP price is slowly moving higher above the $2.920 support zone. The price is now trading below $3.00 and the 100-hourly Simple Moving Average. There is a key declining channel forming with resistance at $3.050 on the hourly chart of the XRP/USD pair (data source from Kraken). The pair could continue to move up if it settles above $3.050. XRP Price Faces Resistance XRP price started a recovery wave after it found support above $2.80 and....
Related News

Solana is taking a breather after a strong rally, now testing the crucial $195 support zone. Traders are watching closely to see if the bulls can defend this level and set the stage for a potential comeback. Solana Begins A Healthy Pullback After Recent Rally In a recent update, BitGuru highlighted that Solana (SOL) appears to be entering a healthy pullback phase following a sharp rally and partial recovery. This retracement is part of a natural market rhythm, allowing the asset to cool off after its recent burst of bullish momentum. Such pauses often serve as a foundation for more....
The Bitcoin price broke below $70,000 over the weekend, effectively erasing the gains from the previous week. This move puts the cryptocurrency in a perilous position as the bulls are now hard-pressed to find another major support or risk the decline going deeper from here. According to one analyst, Bitcoin bulls will have to reclaim and hold $69,000 with momentum in order to trigger another recovery trend. Why Bitcoin Bulls Must Hold $69,000 According to crypto analyst Tealstreet, the bulls will need to defend $69,000 to prevent the Bitcoin price from falling lower. The reason for this is....

The Bulls are not allowing the downward medium-term trend to continue, but the Bears are not going to give up their ground easily either. The bounce off of the level of $409 and the fortification at $410.5 served as a good indication for a short-term upward movement to $415. At the level of $415, the initiative was seized by the sellers. As was mentioned earlier, this point is very profitable for them. However, the Bulls have managed to hold the price at the new level of $411. There is a possibility of a third wave forming at the $411 mark, which will keep growing until $445, if the Bulls....

Bulls have been struggling to gain decisive control of Bitcoin throughout the past few days and weeks This has resulted in it being quite heavy, with each rally being aggressively sold into as bears aim to push it back down to $30,000 Despite this, the crypto has been able to hold strong within the lower-$30,000 region, and every dip below $30k has been met with massive buy-side support There’s a possibility that this support is […]
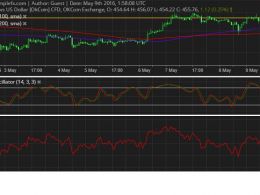
Bitcoin price found support at a broken resistance level but indicators suggest that sellers still have a chance. The 100 SMA is above the longer-term 200 SMA so the path of least resistance is to the upside and the rally could carry on up to $470 or higher. In addition, the 200 SMA held as dynamic support in the past so it might continue to keep losses in check from here. However, stochastic is indicating overbought conditions and is turning lower so bitcoin price could follow suit. This could take price down to the near-term support at $450 once more or until $440. Stronger selling....