
Ethereum Price Bounce Looks Fragile, Another Selloff May Be Brewing
Ethereum price started a recovery wave above the $2,100 zone. ETH is now consolidating and might struggle to continue higher above the $2,150 resistance. Ethereum started a recovery wave from the $2,075 zone. The price is trading below $2,120 and the 100-hourly Simple Moving Average. There is a bearish trend line forming with resistance at $2,120 on the hourly chart of ETH/USD (data feed via Kraken). The pair could start a fresh decline if it stays below the $2,150 zone. Ethereum Price Faces Hurdles Ethereum price remained bid above the $2,050 support zone, like Bitcoin. ETH price formed a....
Related News
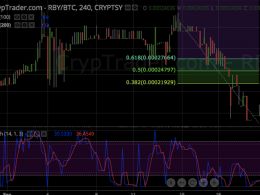
Rubycoin Price Key Highlights. Rubycoin price is still completing its corrective wave on the 4-hour time frame, as price is stalling around the 61.8% Fibonacci retracement level. A short-term double top pattern can be seen right on the resistance, indicating that the impulse wave might be ready to start. Rubycoin price is gearing up for another sharp drop to its previous lows after making a pullback on its selloff. Bears Waiting. Stochastic is pointing down, which means that selling momentum is in play, but bears might be holding out for more confirmation. A break below the double top....

Ethereum Price Key Highlights. Ethereum price is gradually trending higher but there are still some signs of consolidation, creating a rising wedge pattern on its 1-hour time frame. Price is currently hovering near the wedge support, as buyers and sellers try to decide whether a bounce or a break is in order. Ethereum price is still picking a direction, with a slight bias to the upside, as bitcoin price is also under a bit of selling pressure. Potential Resistance at 0.00300? A bounce off the wedge support around 0.00260 could lead to a move up to the top of the pattern just past the....

Ethereum (ETH) is trading at a crucial juncture after reclaiming the $3,450 level, showing early signs of stabilization following weeks of volatility. While bulls are slowly regaining ground, upward momentum remains fragile as traders await confirmation of a sustained breakout. The recent bounce has sparked renewed optimism, but Ethereum still faces significant resistance around the […]

Ethereum Price Key Highlights. After forming a head and shoulders pattern indicated in yesterday's technical analysis article, ethereum price broke below the neckline and confirmed the potential selloff. Price also broke below the rising trend line support, adding to the downtrend signals on the 1-hour time frame. Ethereum price could have its sights set on the next visible floor around 0.0200, although a pullback to the broken neckline and trend line support might be seen. Resistance at 61.8% Fib? The 61.8% Fibonacci retracement level is closest to the broken rising trend line and is also....

Bitcoin Price Key Highlights. Bitcoin price has gradually been trending higher but it looks like the rally is starting to lose steam. Price might be forming a head and shoulders pattern on its 1-hour time frame, as the recent bounce off the Fib levels barely gained traction. Bitcoin price could be due for another selloff if the reversal formation is completed and a downside break of the neckline is seen. Short-Term Area of Interest. Using the Fib tool on the latest down move shows that the 50% level lines up with an area of interest around $365. This also coincides with the 100 SMA, which....