
XRP Price Upside Threatened as $1.42 Emerges Key Resistance
XRP price started a recovery wave above $1.3820 but failed near $1.420. The price is now consolidating and might aim for a fresh move above $1.420. XRP price started a recovery wave above the $1.3820 zone. The price is now trading below $1.3880 and the 100-hourly Simple Moving Average. There was a break above a bearish trend line with resistance at $1.360 on the hourly chart of the XRP/USD pair (data source from Kraken). The pair could continue to move up if it settles above $1.40. XRP Price Faces Resistance XRP price remained supported above $1.30 and started a recovery wave, like Bitcoin....
Related News

Bitcoin‘s potential for a significant upside move in the short term continues to gain traction as a positive price trend emerges on its daily chart. With upward momentum currently building, the much-anticipated next move will put the digital asset back above the pivotal $100,000 mark. A Bullish Price Breakout For Bitcoin On The Horizon? In […]

Key Highlights. Dogecoin price is trading near a major resistance area of 40.0 Satoshis, as buyers eye a break. The price is following a support trend line on the hourly chart, which may push the price to higher levels moving ahead. A break above 40.5-40.9 Satoshis is needed for an upside move towards 44-45.0 Satoshis. Dogecoin price looks poised for an upside move likely towards 45.0 Satoshis, if sellers fail to defend the 41.0 Satoshis resistance area. Dogecoin Price Hurdled By Resistance at 41.0 Satoshis: There were a few positive signs witnessed last week throughout Dogecoin's charts,....
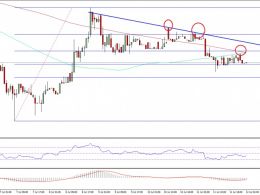
Ethereum price after weakening started trading in a range. It looks like it is facing a tough resistance on the upside, which is stalling gains. Key Highlights. Ethereum price after a decline against the US Dollar started a consolidation below a major resistance area. There is a bearish trend line formed on the hourly chart (data feed via Kraken) of ETH/USD, which can be seen as a major barrier for an upside move. The price is below the 100 hourly simple moving average, which is also acting as a resistance zone. Ethereum Price Resistance. Ethereum price ETH after moving a few points below....
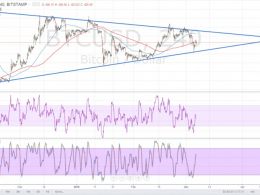
Bitcoin price just came off a test of the triangle support and might be due for another move towards resistance. The 100 SMA is above the 200 SMA, signaling that the path of least resistance is to the upside. Stochastic is on the move up, which also confirms that buyers are in control of price action for now, likely pushing for a test of the triangle top around $420-430. RSI is also heading north so price might follow suit. Stronger bullish pressure might even lead to an upside break of the triangle resistance and a prolonged uptrend for bitcoin price. In that case, price could resume its....

Bitcoin failed to clear the $25,000 resistance zone against the US Dollar. BTC is declining and might break the $23,250 support zone. Bitcoin attempted a clear move towards the $25,000 resistance but failed. The price is now trading below the $24,000 level and the 100 hourly simple moving average. There was a break below a key bullish trend line with support near $23,750 on the hourly chart of the BTC/USD pair (data feed from Kraken). The pair must clear the $24,200 resistance to continue higher in the near term. Bitcoin Price Signals Breakdown Bitcoin price gained pace above the $23,500....