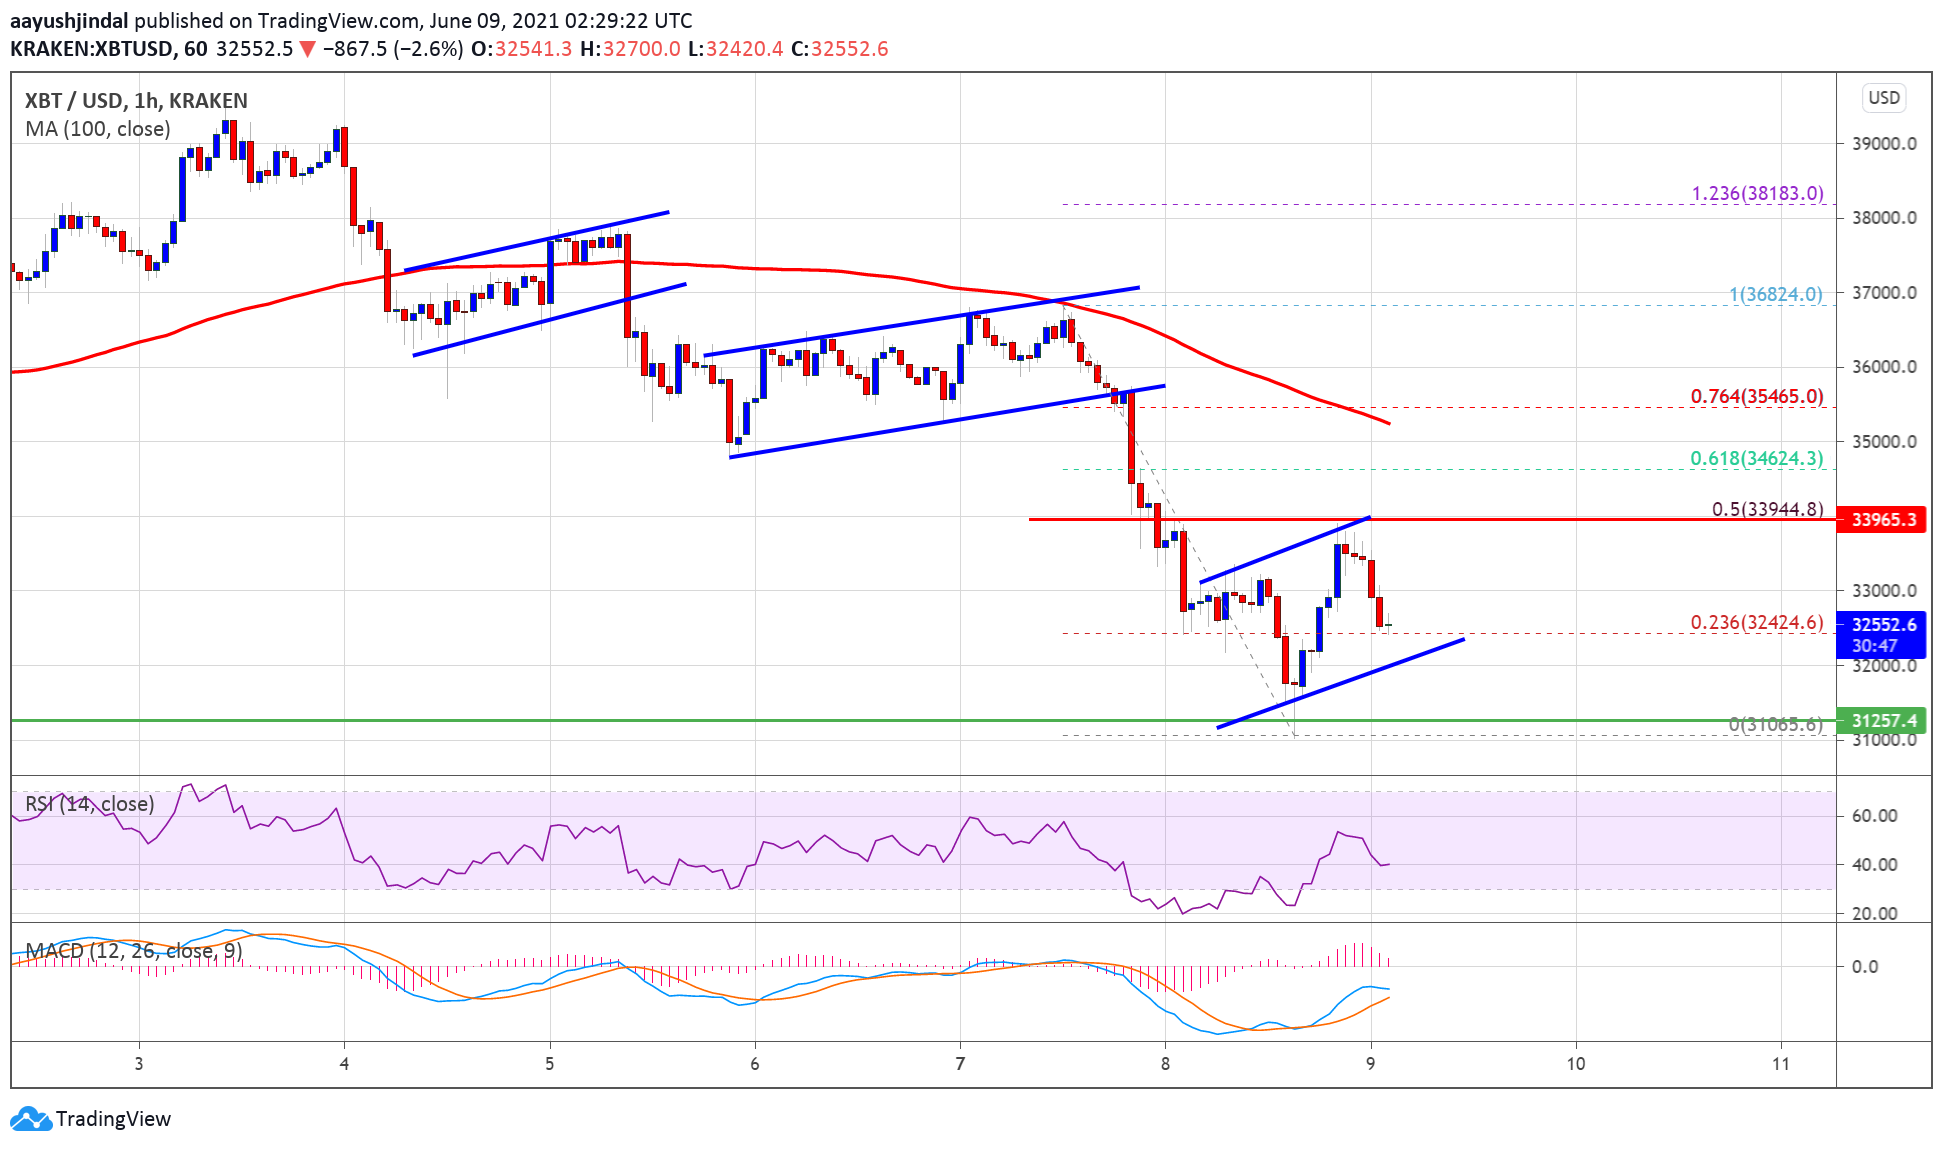
TA: Bitcoin Extends Losses, Why $30K Holds The Key For Next Wave
Bitcoin price extended its decline below the $33,000 support zone against the US Dollar. BTC is currently recovering and it must stay above $30,000 to avoid a larger decline. Bitcoin extended its decline below the $33,500 and $33,000 support levels. The price is currently well below $35,000 and the 100 hourly simple moving average. There […]
Related News

Bitcoin price failed to start a recovery wave above the $61,500 resistance zone. BTC started another decline and might dive toward $55,000. Bitcoin started a fresh decline and traded below the $58,500 zone. The price is trading below $60,000 and the 100 hourly Simple moving average. There is a key bearish trend line forming with resistance at $58,350 on the hourly chart of the BTC/USD pair (data feed from Kraken). The pair might struggle to start a fresh increase above the $60,000 resistance zone. Bitcoin Price Extends Losses Bitcoin price struggled to start a decent recovery wave above....

ATOM fell towards a three-week low on Thursday, as crypto markets were victim to yet another red wave. Overall, markets are down nearly 5% as of writing, with GRT dropping by almost 10% lower on the day. Cosmos (ATOM) ATOM dropped towards a three-week low during Thursday’s session, as global crypto markets were nearly 5% lower. Following a peak of $10.46 on hump-day, ATOM/USD slipped to an intraday low of $9.23 earlier in today’s session. This move sees ATOM back to its long-term support level of $9.30, which has mainly been holding firm since May 12. However, with prices....

After earlier spells of consolidation, the tide turned on cryptocurrencies this afternoon, with markets finding themselves in a red wave. Quant managed to evade the wave, climbing by as much as 20% during the session.
Biggest gainers
Following yesterday’s strong gains, the global cryptocurrency marketplace was trading over 6% lower on Wednesday, however, there were some notable exceptions.
Quant was one of these exceptions and was easily one of the biggest movers in the crypto top 100 during today’s session.
QNT/USD hit an intraday high of....

The market is continuing to break down as we have been expecting on these pages for the past several weeks. While I believe that the bear market will come to an end rather soon, I also anticipate that the market may finish its bear season with a vicious roar. I have stated on more than one occasion that I suspect that $316 will hold (on a daily closing basis). However, it would not surprise me if there were to be an intraday spike low that reached lower in the days ahead. For Elliott Wave reasons, I would be VERY surprised if the price went below $266, even briefly. Elliott Wave has but a....
Bitcoin price started a fresh decline below the $74,000 zone. BTC is consolidating and might struggle to stay above the $72,000 support. Bitcoin failed to stay above $75,000 and extended losses. The price is trading below $74,000 and the 100 hourly simple moving average. There is a bearish trend line forming with resistance at $73,750 on the hourly chart of the BTC/USD pair (data feed from Kraken). The pair might extend losses if it stays below the $74,000 and $75,000 levels. Bitcoin Price Extends Losses Bitcoin price failed to stay above the $75,500 support zone. BTC remained in a bearish....