
Ethereum Price Technical Analysis – ETH/USD Break Looks Real
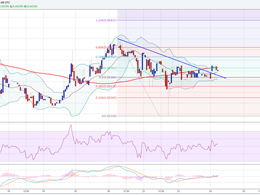
Ethereum price collapsed against the US Dollar due to a sharp selling in BTC after the PBOC investigation announcement. More losses to follow in ETH/USD? Key Highlights. ETH price made a sharp downside move against the US Dollar, and broke the $9.80 support zone. Yesterday’s highlighted connecting bullish trend line on the hourly chart (data feed via SimpleFX) of ETH/USD was cleared to open the gates for more declines. There was a sharp decline in Bitcoin price due to the PBOC investigation announcement, which caused a decline in ETH too. Ethereum Price Declines. ETH price was seen holding....
Related News
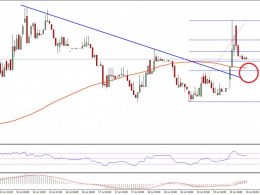
Ethereum Price Key Highlights. Ethereum price finally managed to break an important resistance around 0.00390BTC-0.0040BTC. It also cleared a bearish trend line formed on the hourly chart, which can be seen as a positive sign. The only question is whether this is a real break or not and can the price continue trading higher. Ethereum price spiked higher Intraday, and broke a resistance trend line as highlighted in yesterday's post. Can it be broken? The Ethereum price after struggling for some time to break a crucial bearish trend line formed on the hourly chart managed to gain traction.....

Ethereum price traded down near $7.0 where buyers appeared. Currently, it looks like there is a chance of ETH/USD breaking higher in the short term. Ethereum price ETH made a perfect bottom near $7.0. I highlighted in yesterday’s analysis that there is a chance of ETH/USD moving down towards $7.0, which can then produce a bounce. The price did test the mentioned level and moved higher later. There was a nice upside reaction, signaling more gains in the near term. ETH/USD is currently attempting to break a bearish trend line on the hourly chart (data feed via Kraken), which is also....
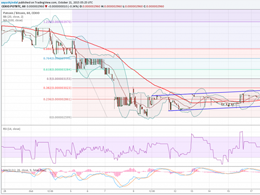
Ethereum price traded higher intraday, and looking at the current technical indicators it looks like it may trade further higher. Key Highlights. Ethereum price managed to move higher against the US Dollar and broke a major resistance area. Yesterday’s highlighted bearish trend line on the hourly chart (data feed via Kraken) of ETH/USD was broken during the recent upside ride. The price is now above the 100 hourly simple moving average, which is a positive sign for the bulls. Ethereum Price Buy. Ethereum price ETH surged higher against the US Dollar and posted a critical break intraday (as....

Technical analysis shows that Ethereum’s price action is currently completing a market structure that shows signs of revival. After weeks of struggling below key levels, Ethereum now appears to have completed a market structure break, with a technical analyst pointing to $1,500 as the zone where buyers have regained control, and a break above $4,000. Ethereum Structure Break And The $1,500 Turnaround Point Crypto analyst SwallowAcademy, in a recent technical breakdown of Ethereum’s weekly candlestick chart, noted that buyers have successfully initiated a clean market structure....
Potcoin Price Key Highlights. Potcoin price continued to trade inside a flag pattern as highlighted in one of the recent technical analysis. Both buyers and sellers seem to be struggling to take the price in one particular direction, which created a range inside the flag pattern. A few technical indicators are pointing towards more losses and a break below the flag pattern. Potcoin price is trading inside a range and it looks like heading towards a break, waiting for a catalyst. Break Down? As mentioned in the previous analysis, there was a sharp decline noted in the Potcoin price which....