
XRP Price Struggles at Resistance With Signals Hinting at a Possible New Decline
XRP price started a recovery wave above $2.050. The price is now showing positive signs but might struggle to clear the $2.10 resistance. XRP price started a recovery wave above the $2.050 zone. The price is now trading above $2.060 and the 100-hourly Simple Moving Average. There is a connecting bearish trend line forming with resistance at $2.090 on the hourly chart of the XRP/USD pair (data source from Kraken). The pair could continue to move up if it settles above $2.160. XRP Price Faces Uphill Task XRP price remained supported above $2.00 and started a recovery wave, like Bitcoin and....
Related News

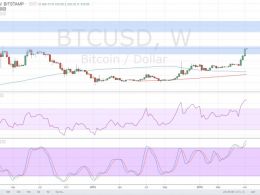
After ten months of decline, the only option for the Bitcoin price seems to be more downside. Analysis considers the state of the decline and defines confirmation signals for trend in the months ahead. Bitcoin Price Chart Overview. Two channels of price action imply two very different paths for price: The red channel, at first glance, seems to be the logical choice and implies a decline low around $200. If price does not break below the purple channel's lower trendline (with a caveat - see below) then, we face the prospect of an immediate advance. Fortunately, we don't have to guess....
Bitcoin price has shown strong upside momentum over the past few weeks and might be eyeing a test of these next ceilings. Bitcoin Price Key Highlights. Bitcoin price made another break higher over the weekend, indicating strong bullish momentum. Price is now testing another long-term area of interest around $700, at which either profit-taking or another upside breakout might be seen. Technical indicators are hinting that the rallies could pause but it would be helpful to look at the next potential resistance levels. Technical Indicators Signals. The 100 SMA is above the 200 SMA for now so....
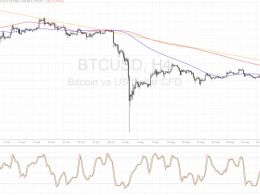
Bitcoin price is still deciding whether to bounce from or break above the descending trend line, depending on how U.S. data turns out. Bitcoin Price Key Highlights. Bitcoin price is still in a downtrend on its longer-term time frames and today’s market catalyst could allow it to resume its selloff. Price has yet to test the descending trend line connecting the highs of price action on the 4-hour chart. Technical indicators seem to be hinting that an upside breakout is possible. Technical Indicators Signals. The 100 SMA is below the longer-term 200 SMA so the path of least resistance could....

Bitcoin price is consolidating below the $46,000 zone against the US Dollar. BTC could start a major decline if it breaks the $44,200 support zone in the near term. Bitcoin is facing a major resistance near $46,000 and $46,200 levels. The price is now trading well below $46,000 and the 100 hourly simple moving average. There is a key bearish trend line forming with resistance near $46,000 on the hourly chart of the BTC/USD pair (data feed from Kraken). The pair could start a major decline if it fails to clear the $46,000 resistance zone. Bitcoin Price Consolidates Bitcoin price failed to....

Bitcoin price slammed through several layers of support to hit a previous long-term resistance level at $465. Although the market seems to have found a bottom, there is not yet any technical reason to believe the decline is complete. Now is the time to count your money and sit out of the market for a few days or weeks. The 4-hour and 1-day timeframe charts gave us MA sell signals, and the 3-day chart gave us MACD and stochastic bearish signals. During the overlap of the late US trading session and early Asia-Pacific sessions, bitcoin price was sold to the resistance-turned-support level at....